close Home Motivation Flow Map Movements Distances Services Method Tools Team

Visualizing Healthcare Accessibility in Singapore

Let's start the exploration!

Motivation

Background

As one of the most densely populated countries in the world, Singapore faces challenges in ensuring equal access to healthcare for all. The high population density has increased the demand for healthcare services, putting strain on the country's medical infrastructure. Although clinics are located in every neighborhood, the quality and intensity of healthcare services vary in different parts of the city-state, leading to disparities in access. Additionally, healthcare services in different geographic areas may experience varying levels of demand, subsequently affecting their ability to provide high-quality care to patients. It is thus critical to assess the spatial distribution of the availability and accessibility of healthcare services.

Movements between towns

The alluvial graph show the estimated flows between each town to seek for clinics. The colors indicate the region of the towns (blue: Central Region, green: East Region, grey: North Region, red: North-East Region, orange: West Region). Most of the same-towns and same colors conncetions are thick, indicating most of the people move locally for accessing healthcare services. More thin cross-regions/cross-towns lines occurr in blue highlighting that the movements for people living in Central Region are more complex. Click here for full-page plot.

Travel Distance

The chart shows the distribution of travel distances for the people living in the five regions of Singapore. The chart highlighted the longer travel distances could be made by people living in the Central Region compared to the other four regions. Click here for full-page plot.

The main result map.

Methodology

Full page image.

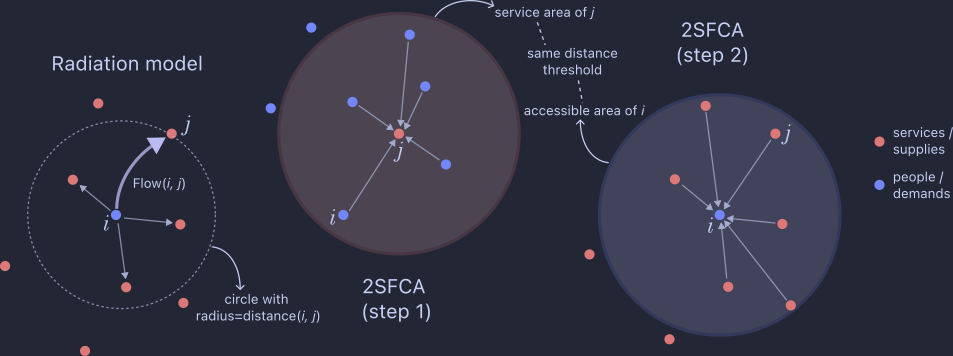
Two main concepts were used in this project: radiation model (Simini et al., 2012) and two-steps floating catchment area (2SFCA, Luo and Wang, 2003). The chart above provides a brief demonstration of the two concepts. The flow between \(i\) and \(j\) is calculated using: $${\langle T_{ij} \rangle = T_i \times \frac{m_i n_j}{(m_i+s_{ij})(m_i+n_j+s_{ij})}}.$$ The service-to-population is calculated using: $${R_j = \frac{N_j}{\sum_{k\in SA_j} P_k }}$$ and the accessibility is then calculated by using: $${A_i = \sum_{j \in S_i} R_j}.$$ The models were adapted based on our analysis setting.

The tools and team.

Data Sources & tools

Data sources

Processing and Analysis

  • QGIS: hexagon generation
  • Pandas: data processing & calculation
  • GeoPandas: geometry & projection
  • OSMNX: routing & distance calculation

Visualization

Web design & hosting

The Team