The 2 Distance-based Approaches
Everyone look for the nearest neighbor vs. everyone draw a series of search buffer (radius).
In this section, we focus on the first approach.
4 examples of point distribution: Clustered or Random?
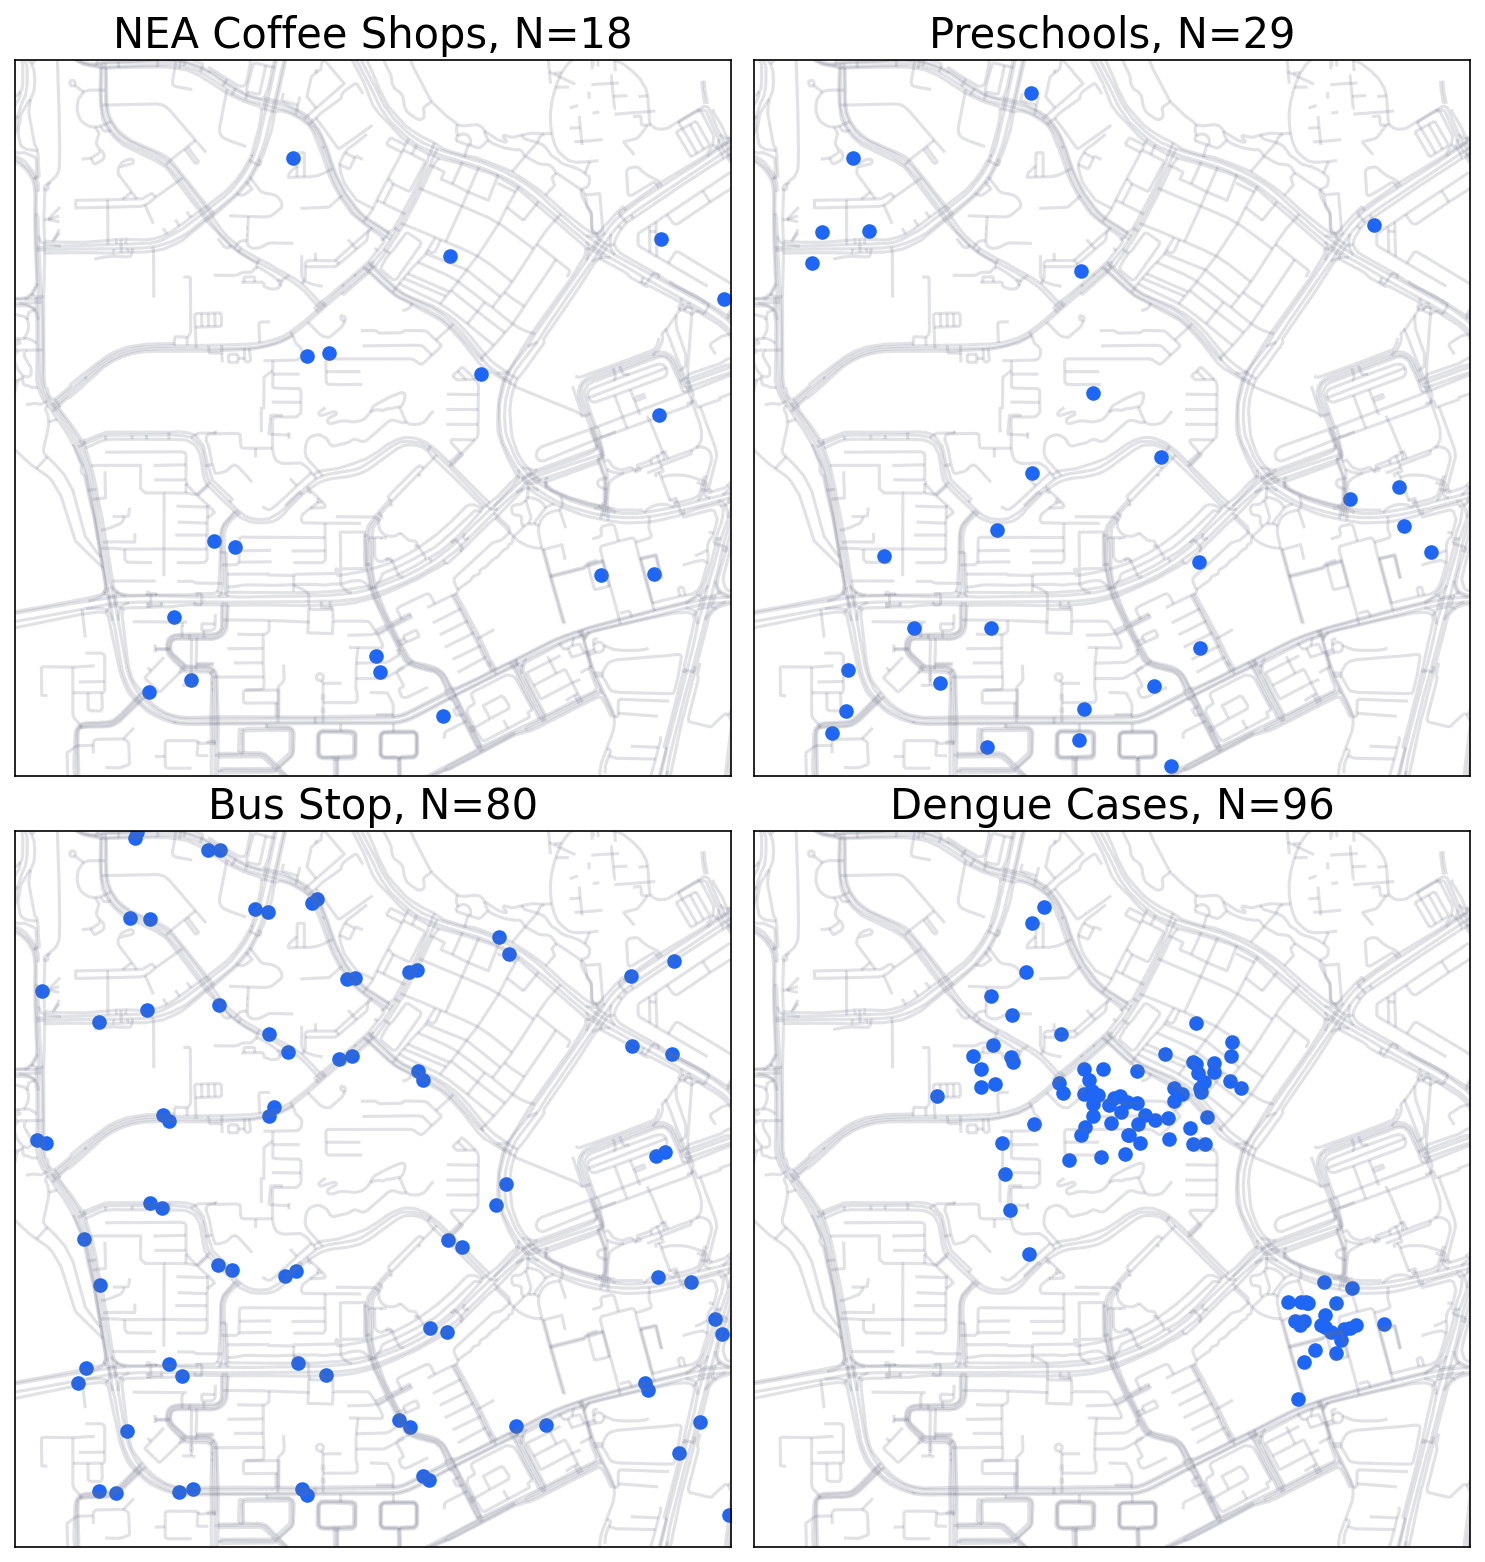
4 types of points in North Singapore: Woodlands Regional Centre, Woodlands West, and Woodgrove, with an area of
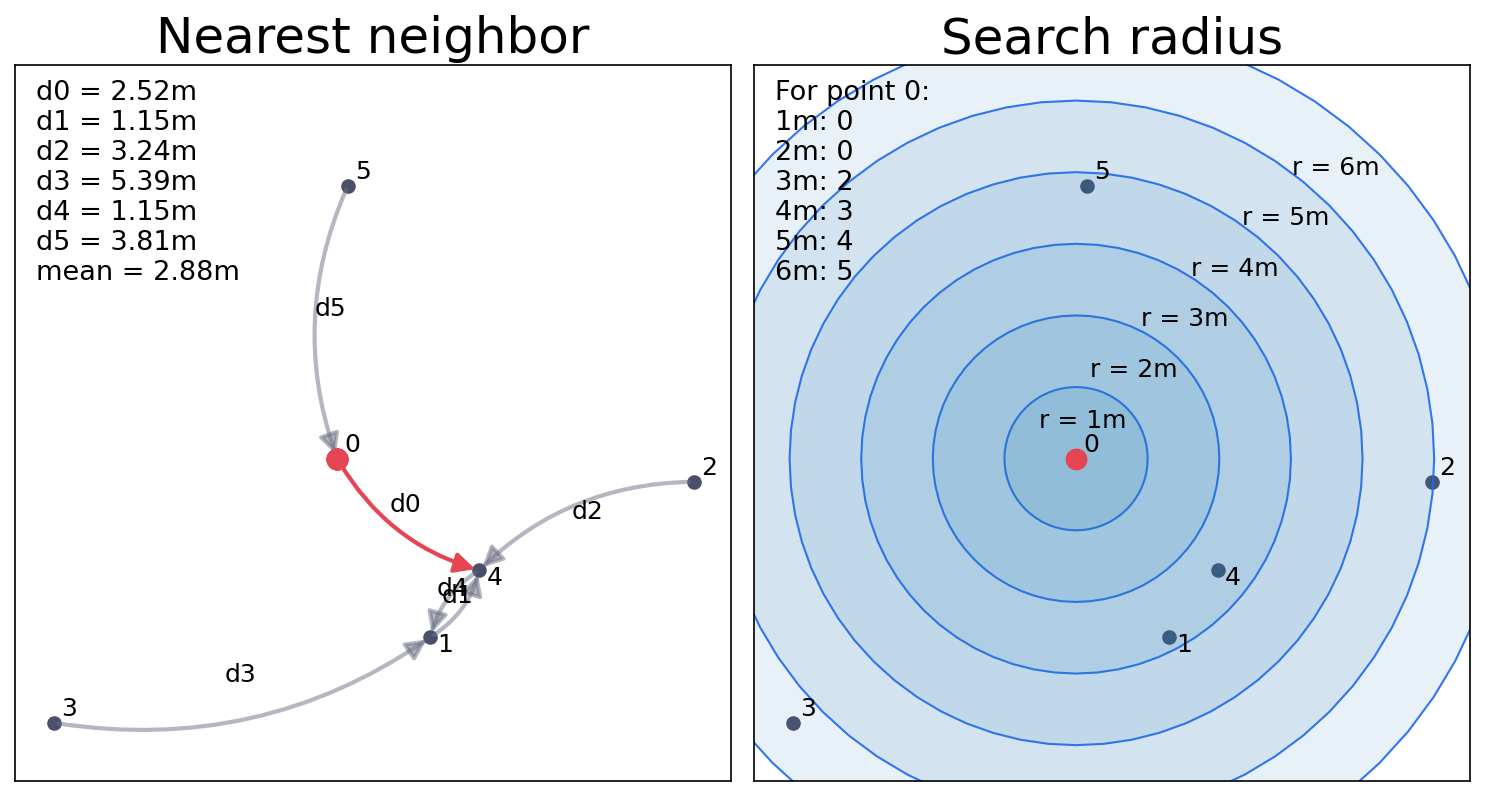
Nearest Neighbor Analysis Calculation Process: In A Nut Shell
Identifying nearest neighbors for every point
Record the nearest neighbor distances
Calculate the mean value
observed average nearest neighbor distance ()
The average nearest neighbor distance:
short: the points are close to each other
long: the points are far from each other
Searching for the nearest neighbors.
How short is short enough to be considered as “clustered”?
Let’s use the Monte Carlo Simulation approach to test the difference between the observed point pattern and a large number of random patterns generated under the CSR assumption.
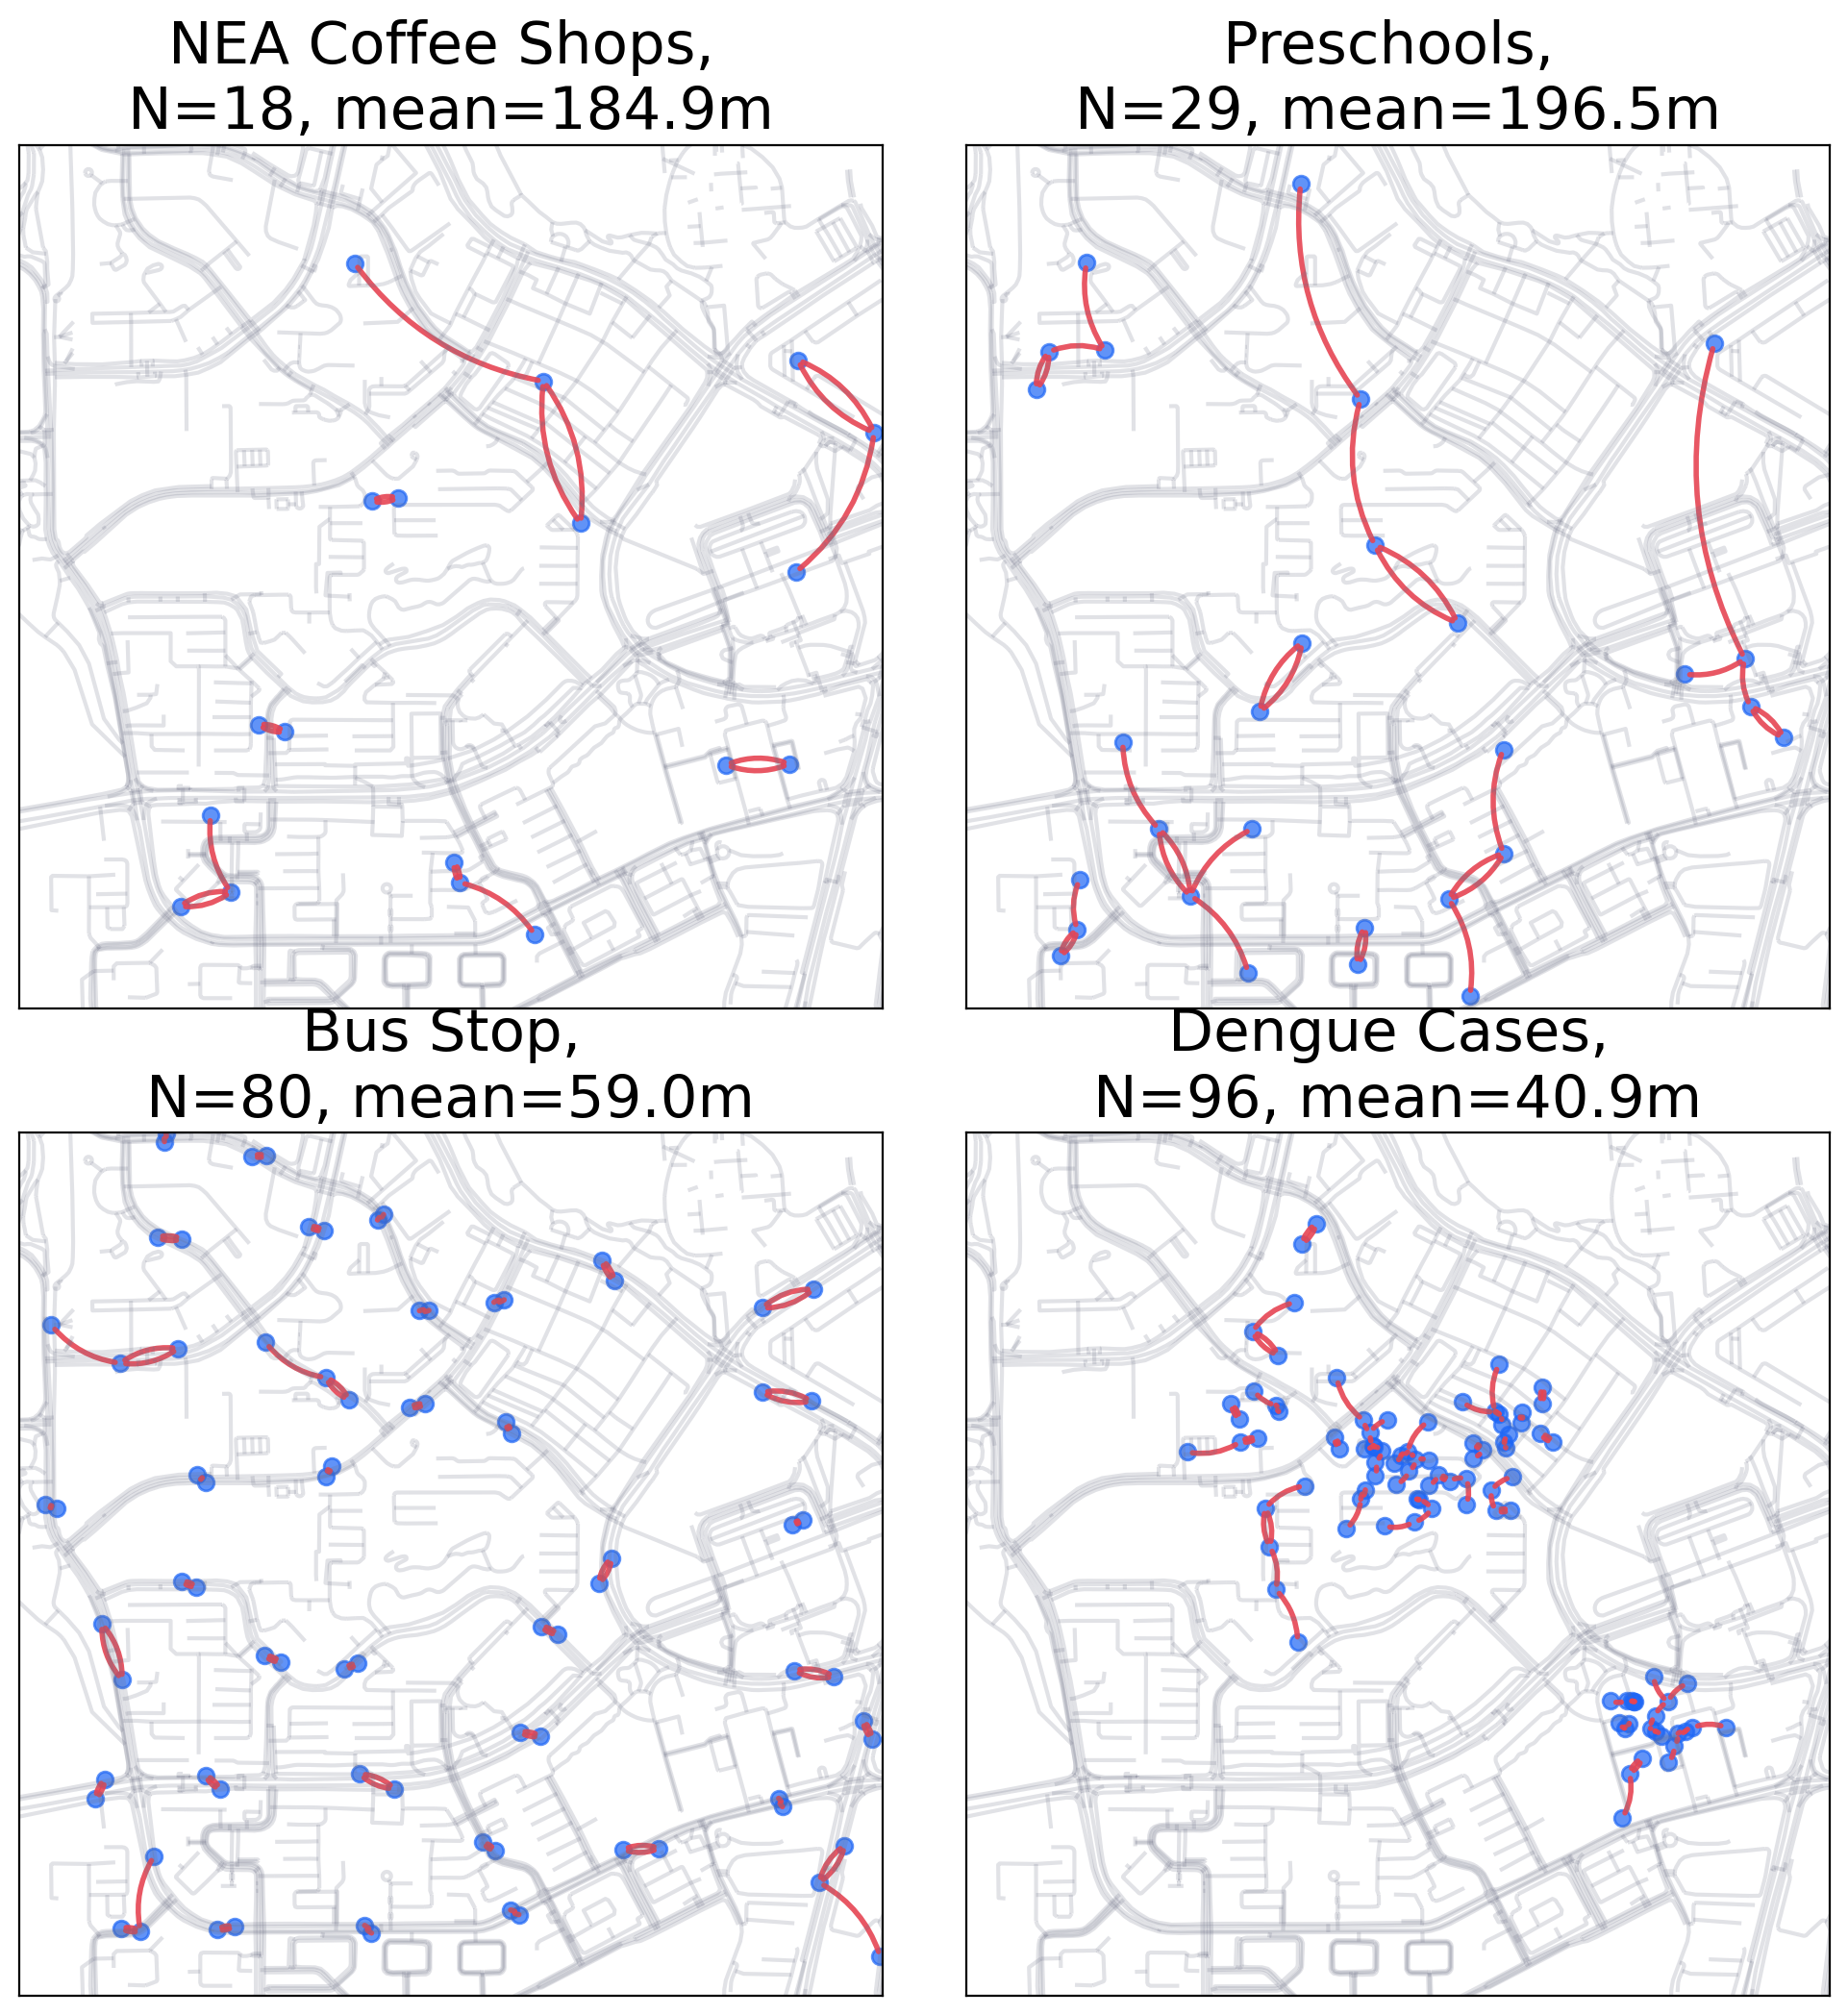
Mean nearest neighbor distances for the four examples.
Option 1: Monte Carlo Simulation
Area size has to match the study area.
Area size will affect the distance between points.
The number of points has to match the dataset.
Within the same area, more points (higher density) will lead to lower nearest neighbor distances.
Monte Carlo Simulation for point pattern.
Statistical Testing
After simulating random for M times, we will get measurement of mean nearest neighbor distances.
The frequency distribution of the N values would form a normal distribution.
The range where the normal distribution is located represent the “random (CSR)” under the specific area and # point setting.
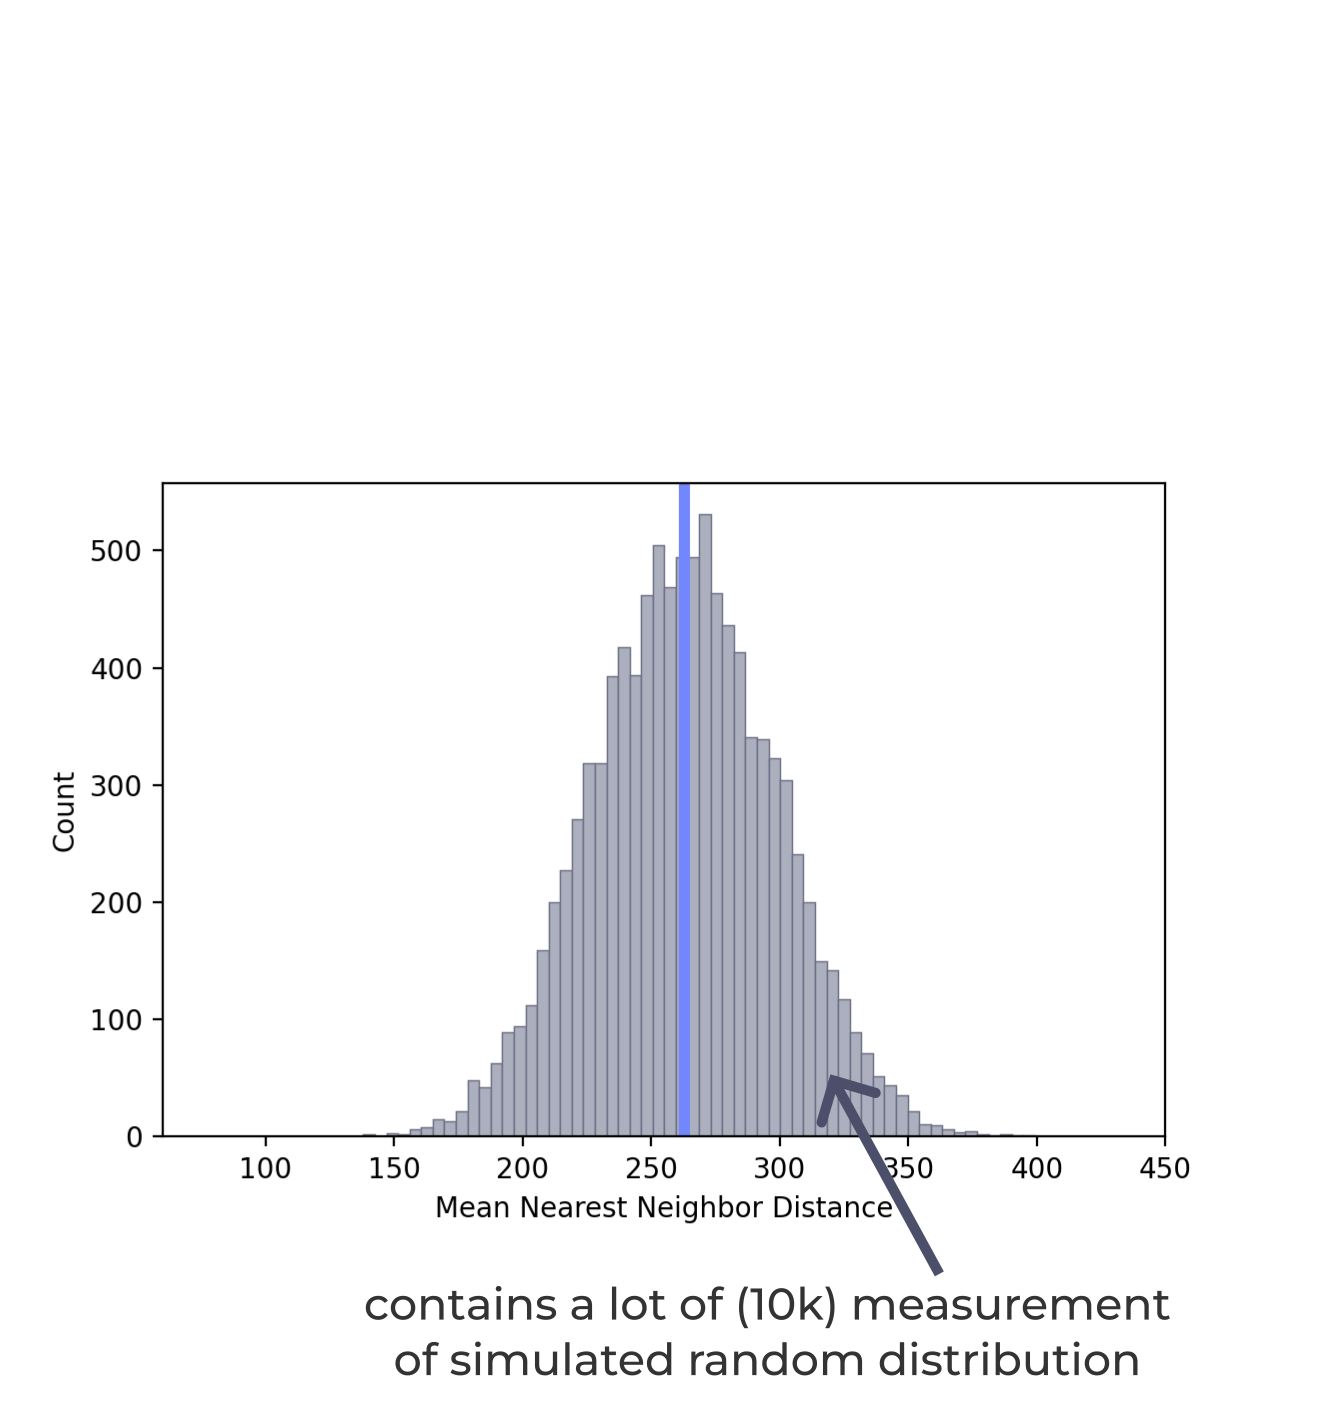
Normal distribution pattern for the frequency of the NNA statistics for the simulated pattern.
(1) If the observed value is far from the random, we found a clear evidence that the observed pattern is different from random.
either clustered or dispersed
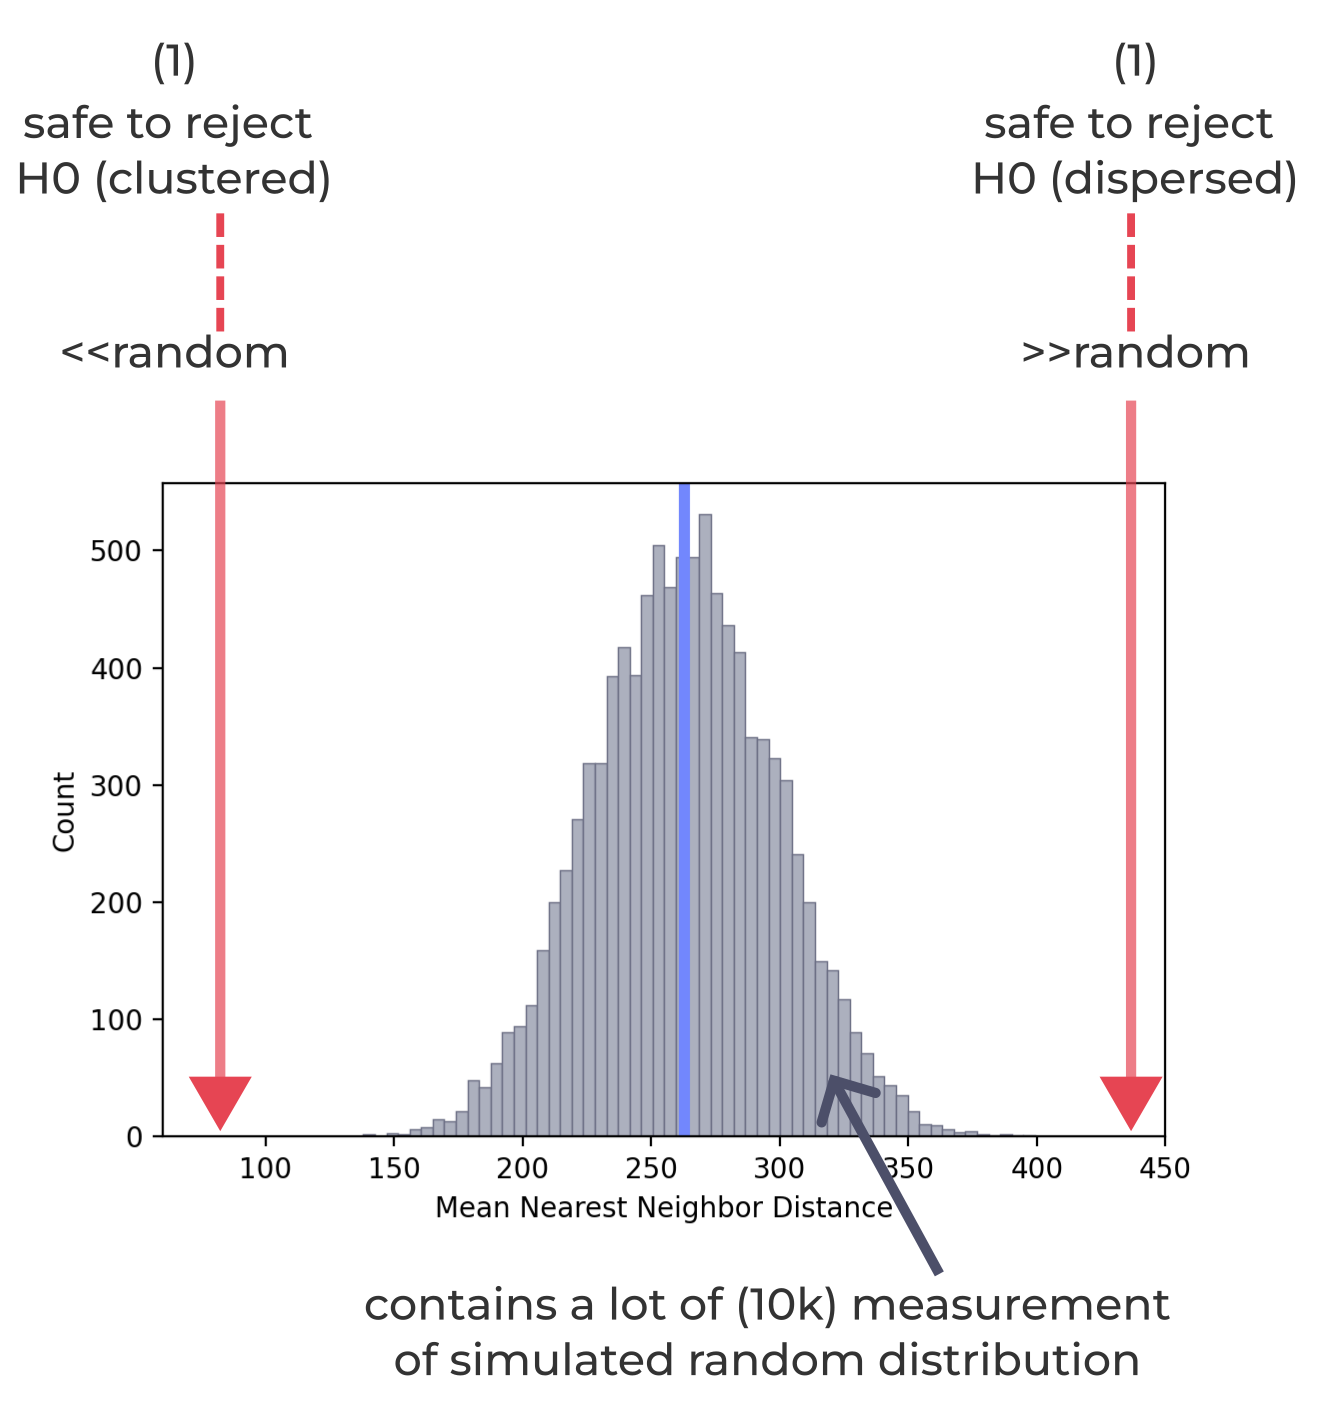
If the oberved value is far from the normal bell shape.
(2) If the observed value fall within the random range, then, we did not find any evidence to prove that the observed pattern is different from random.
cannot reject the null hypothesis
we have no choice but to believe it is random
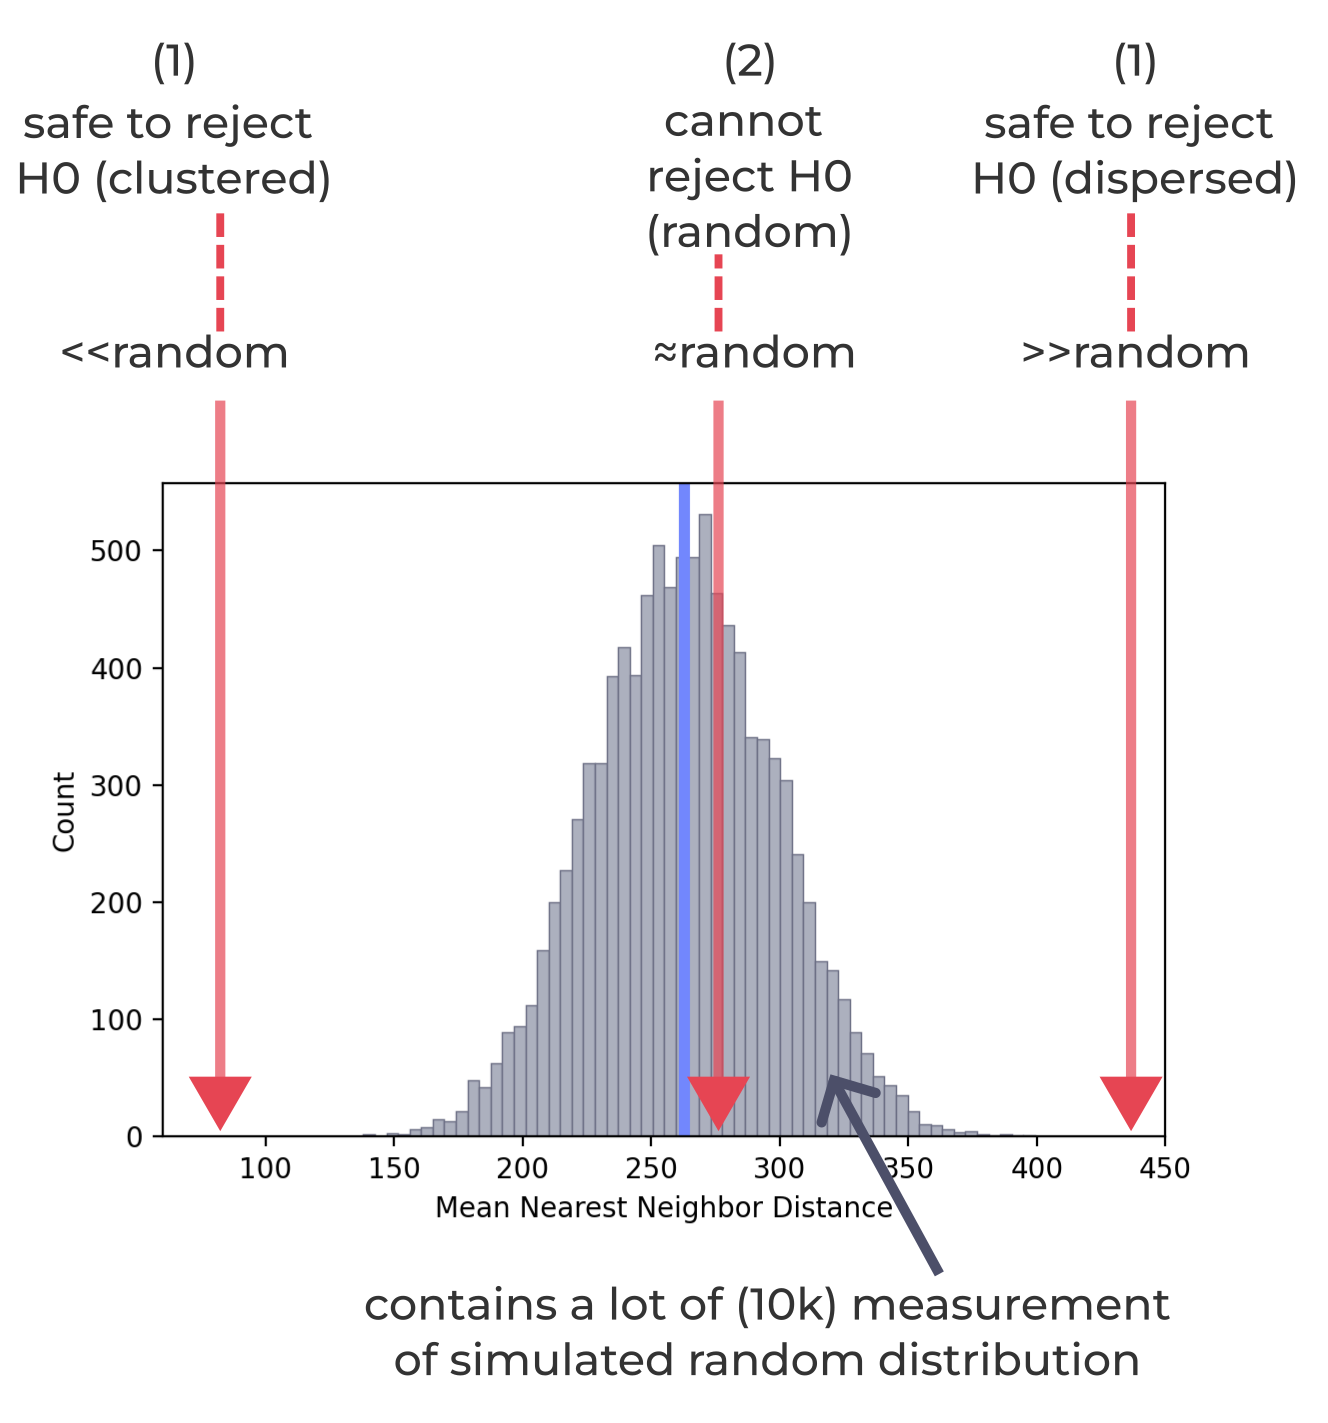
If the oberved value fall within the normal bell shape.
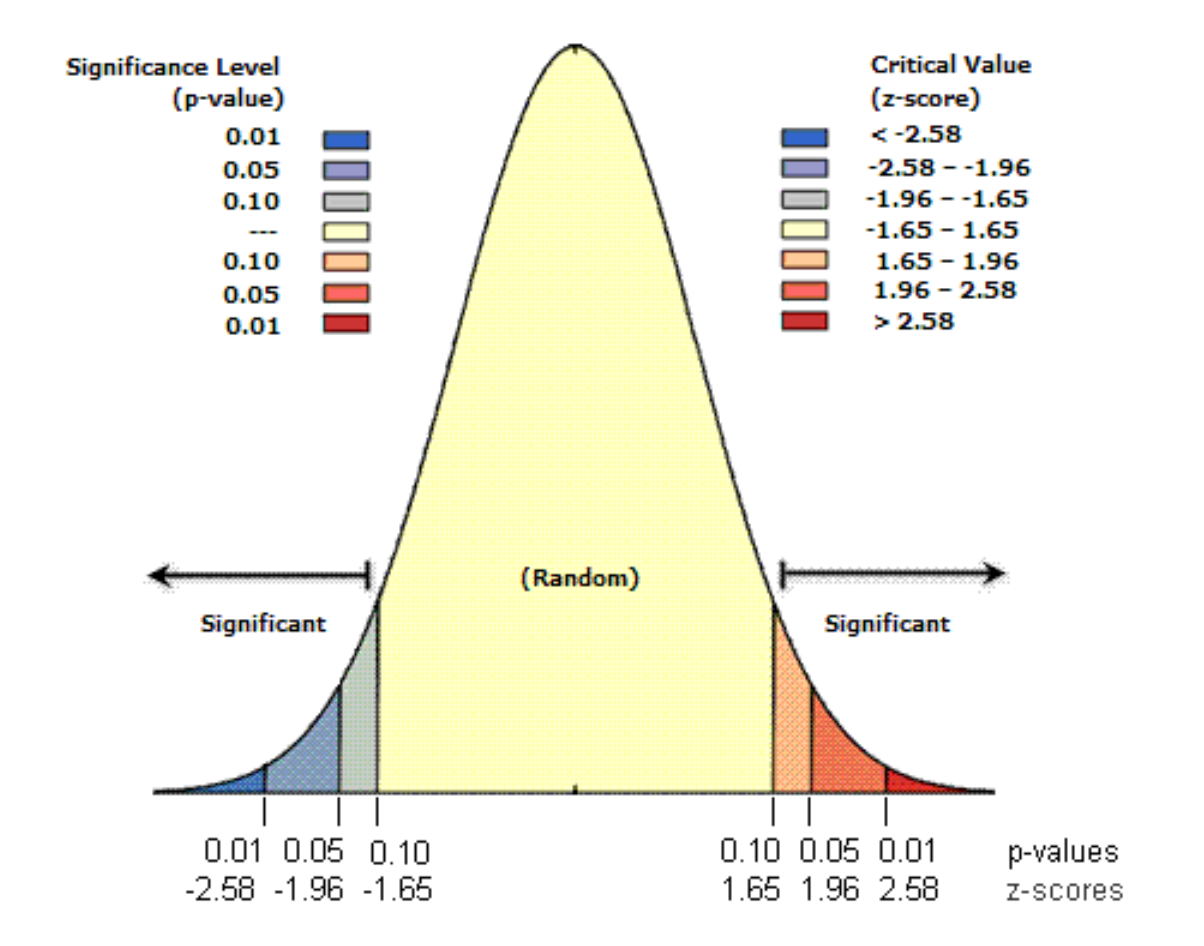
(3) If the observed fall at the edge of the normal distribution
check p-value and your confidence level setting.
p-value: the probability of being wrong to reject null hypothesis
See [ESRI “What is a z-score? What is a p-value?”(https://
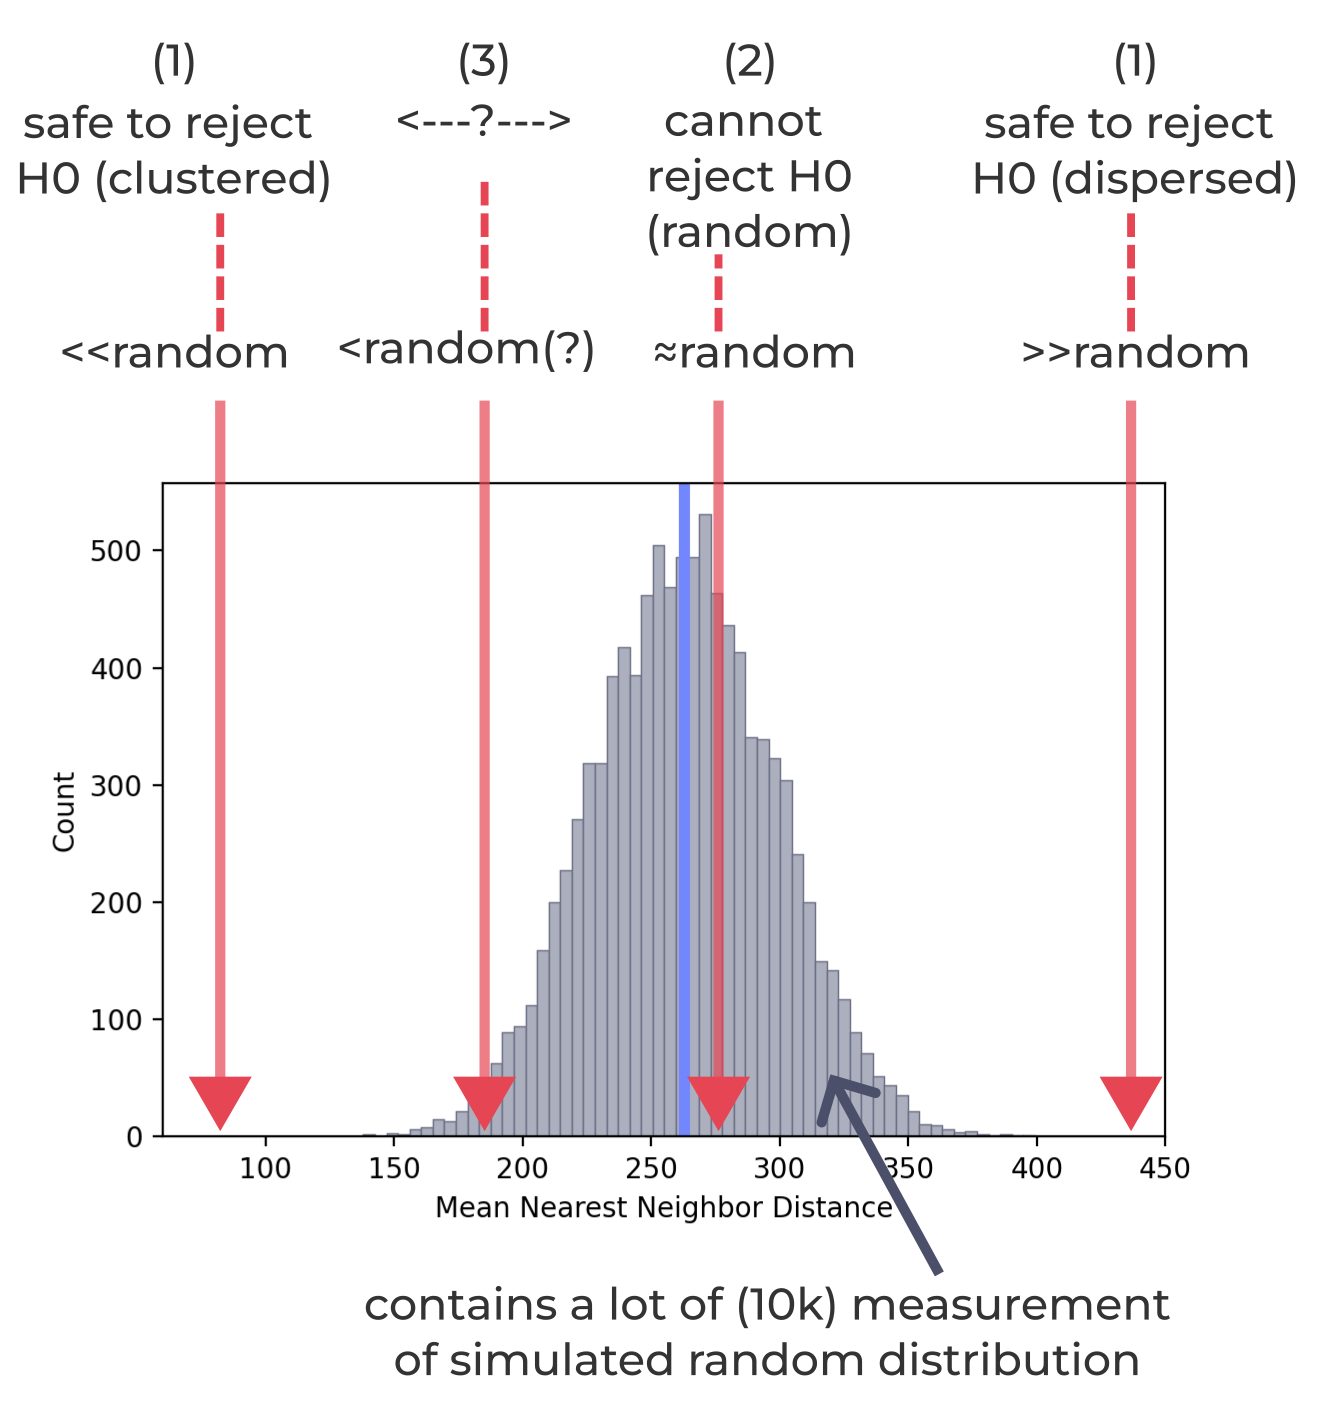
If the oberved value fall within or near to the edge of the normal bell shape.
Let’s say we set the confidence level to 99%, meaning we are willing to accept a 1% risk of being wrong (incorrectly rejecting the null hypothesis, H0). If the obtained p-value is 3%, which is higher than our acceptable risk, then we cannot reject H0.
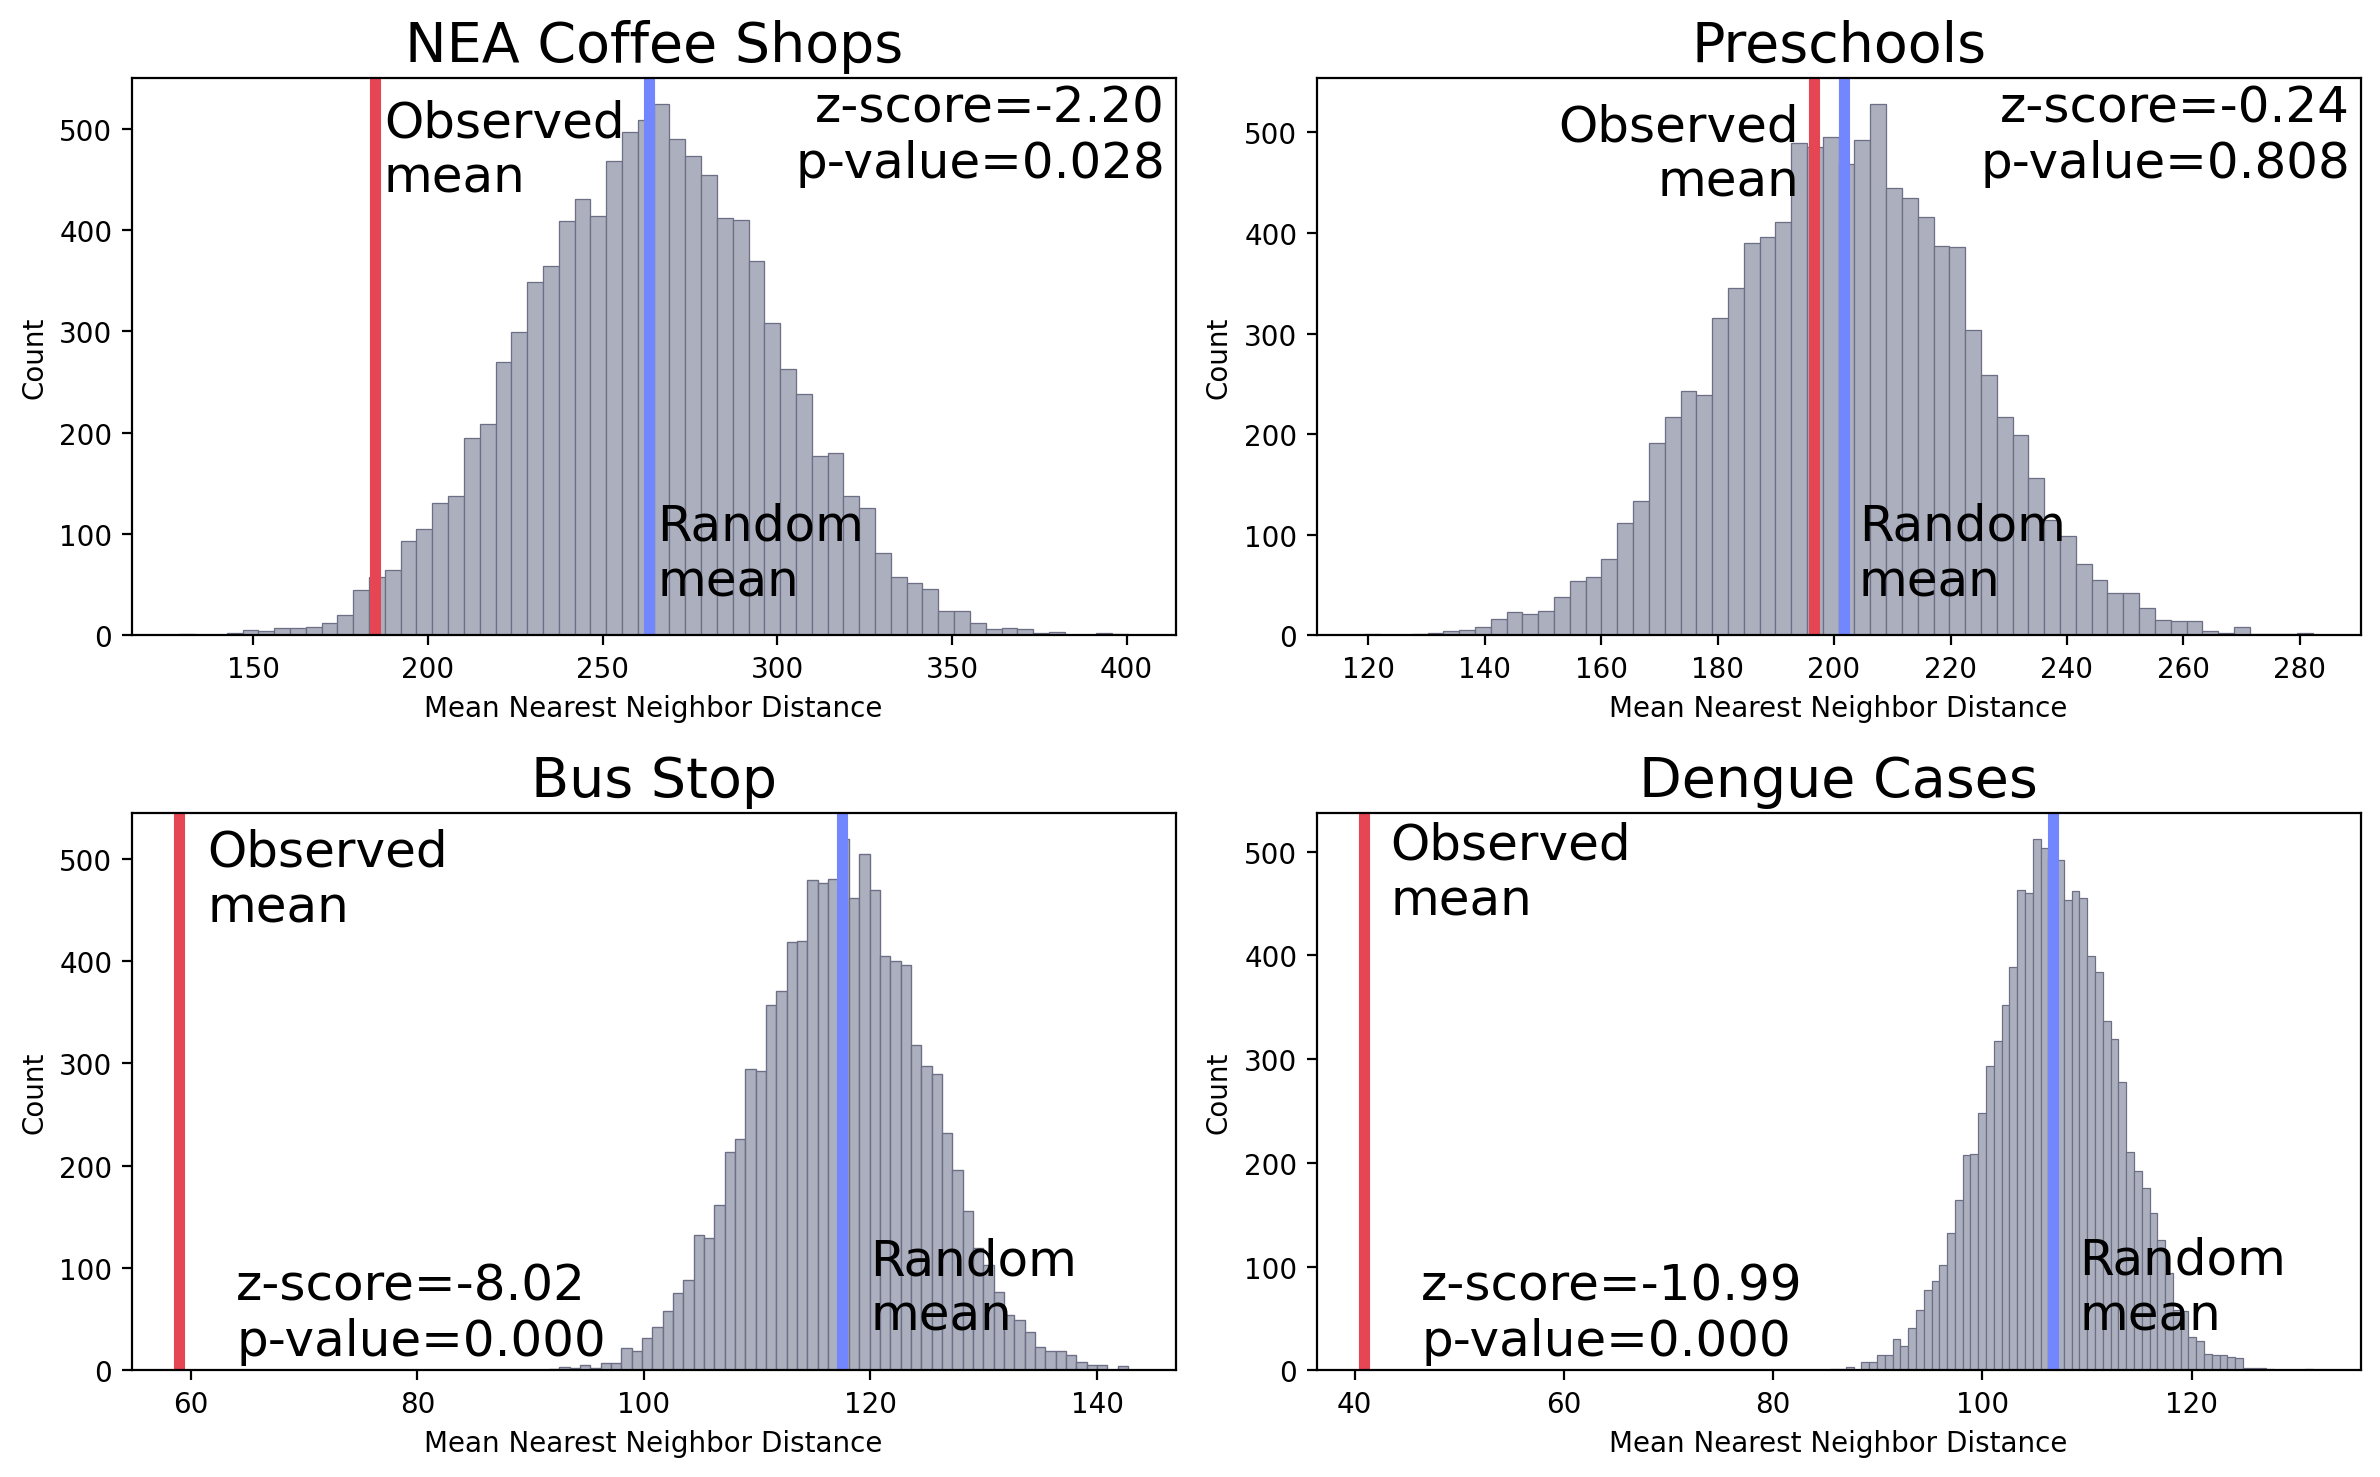
How the observed mean compared with 10k CSR simulations mean results?
The grey area indicates the mean nearest neighbor distance of the 10k random pattern.
Option 2: Z-test approach
Z-test is another option for testing the significant levels of how observed nearest neighbor distance () is different from the ‘expected’ average nearest neighbor distance () under CSR.
See ESRI for detail.
The nearest neighbor distance ratio:
If the index () is less than 1, the pattern exhibits clustering. If the index is greater than 1, the trend is toward dispersion.
The expected mean distance could be calculated using the number of point (n) and the study area (A):
The z-score can then be calculated using and :
The z-score and p-value for this statistic are sensitive to changes in the study area or changes to the Area parameter. For this reason, only compare z-score and p-value results from this statistic when the study area is fixed.
Z-test and z-score. See ESRI “What is a z-score? What is a p-value?” for more details.
Summary: Nearest Neighbor Analysis (NNA)
This approach calculates the average distance of the nearest neighbor for every point.
The observed average nearest neighbor distance can be tested using a Monte Carlo Simulation or z-test approaches against the null hypothesis of CSR.
The NNA has an assumption that the points being measured are free to locate anywhere within the study area (for example, there are no barriers, and all cases or features are located independently of one another).