The 2 Distance-based Approaches
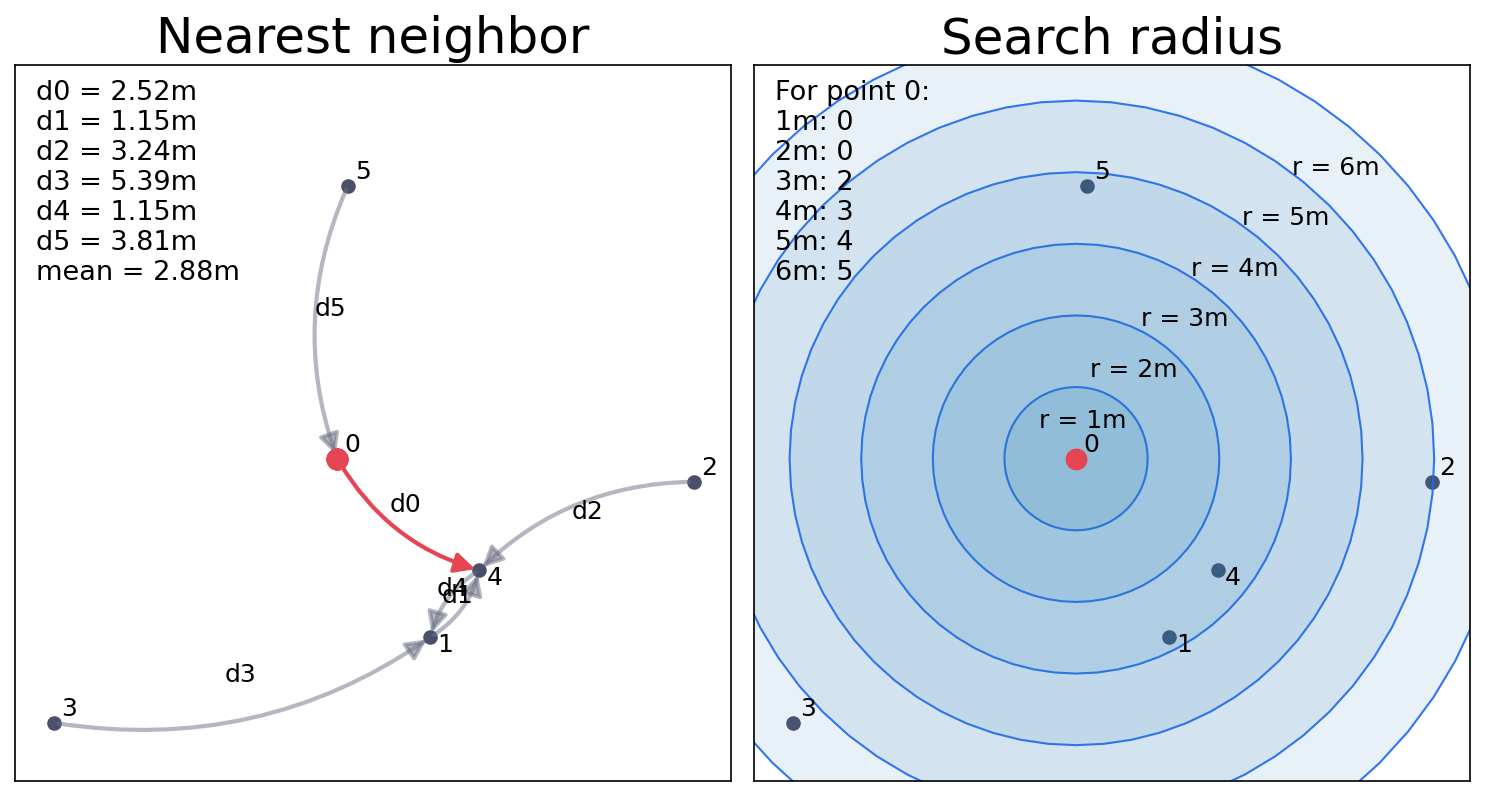
Everyone look for the nearest neighbor vs. everyone draw a series of search buffer (radius).
In this section, we focus on the second approach.
Bus Stops Distribution
Take bus stops distribution for example:
Bus stops usually constructed in pairs, at both sides of a street.
The nearest neighbor is at a short distance (opposite of street), but the second nearest may not.
Is it a “real” clustered pattern?
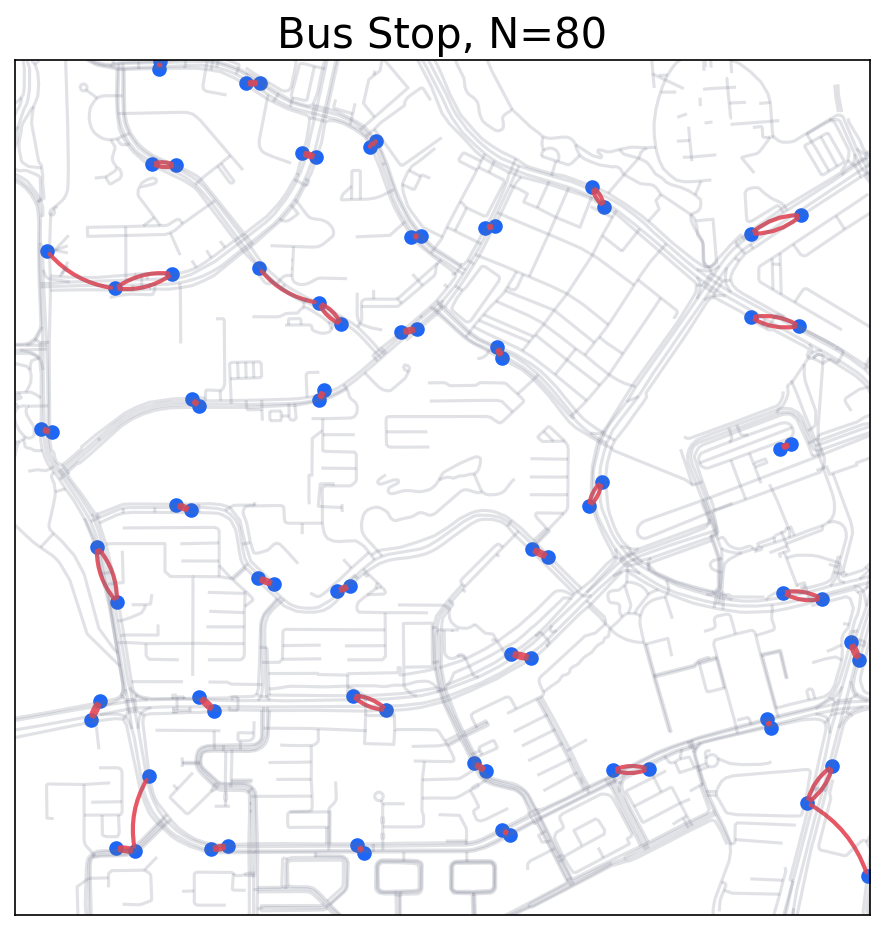
Bus Stops distribution. Is the nearest neighbor distance ‘meaningful’?
The Search Radius Approach
The Ripley’s K-function:
Generate a series of search radius (SR), from low to high
Search for pairs of points fall within every SR
The implication:
if a lot of pairs are found within a short SR: the points are clustered at this distance.
Simulation of the buffer area and counting.
A common transformation of the K-function:
: the k-function value at search radius
: the number of pairs of points with distance less than
: equal to 1 if non-weighted; weighting for edge-correction
: Area of study
: total number of points
: total number of all pairs
More info: ESRI ArcGIS: How multi-distance spatial cluster analysis works.
Testing for K-functions
How high is high enough to be considered as clustered?
To compare them with CSR, Monte Carlo Simulation can be used (again)
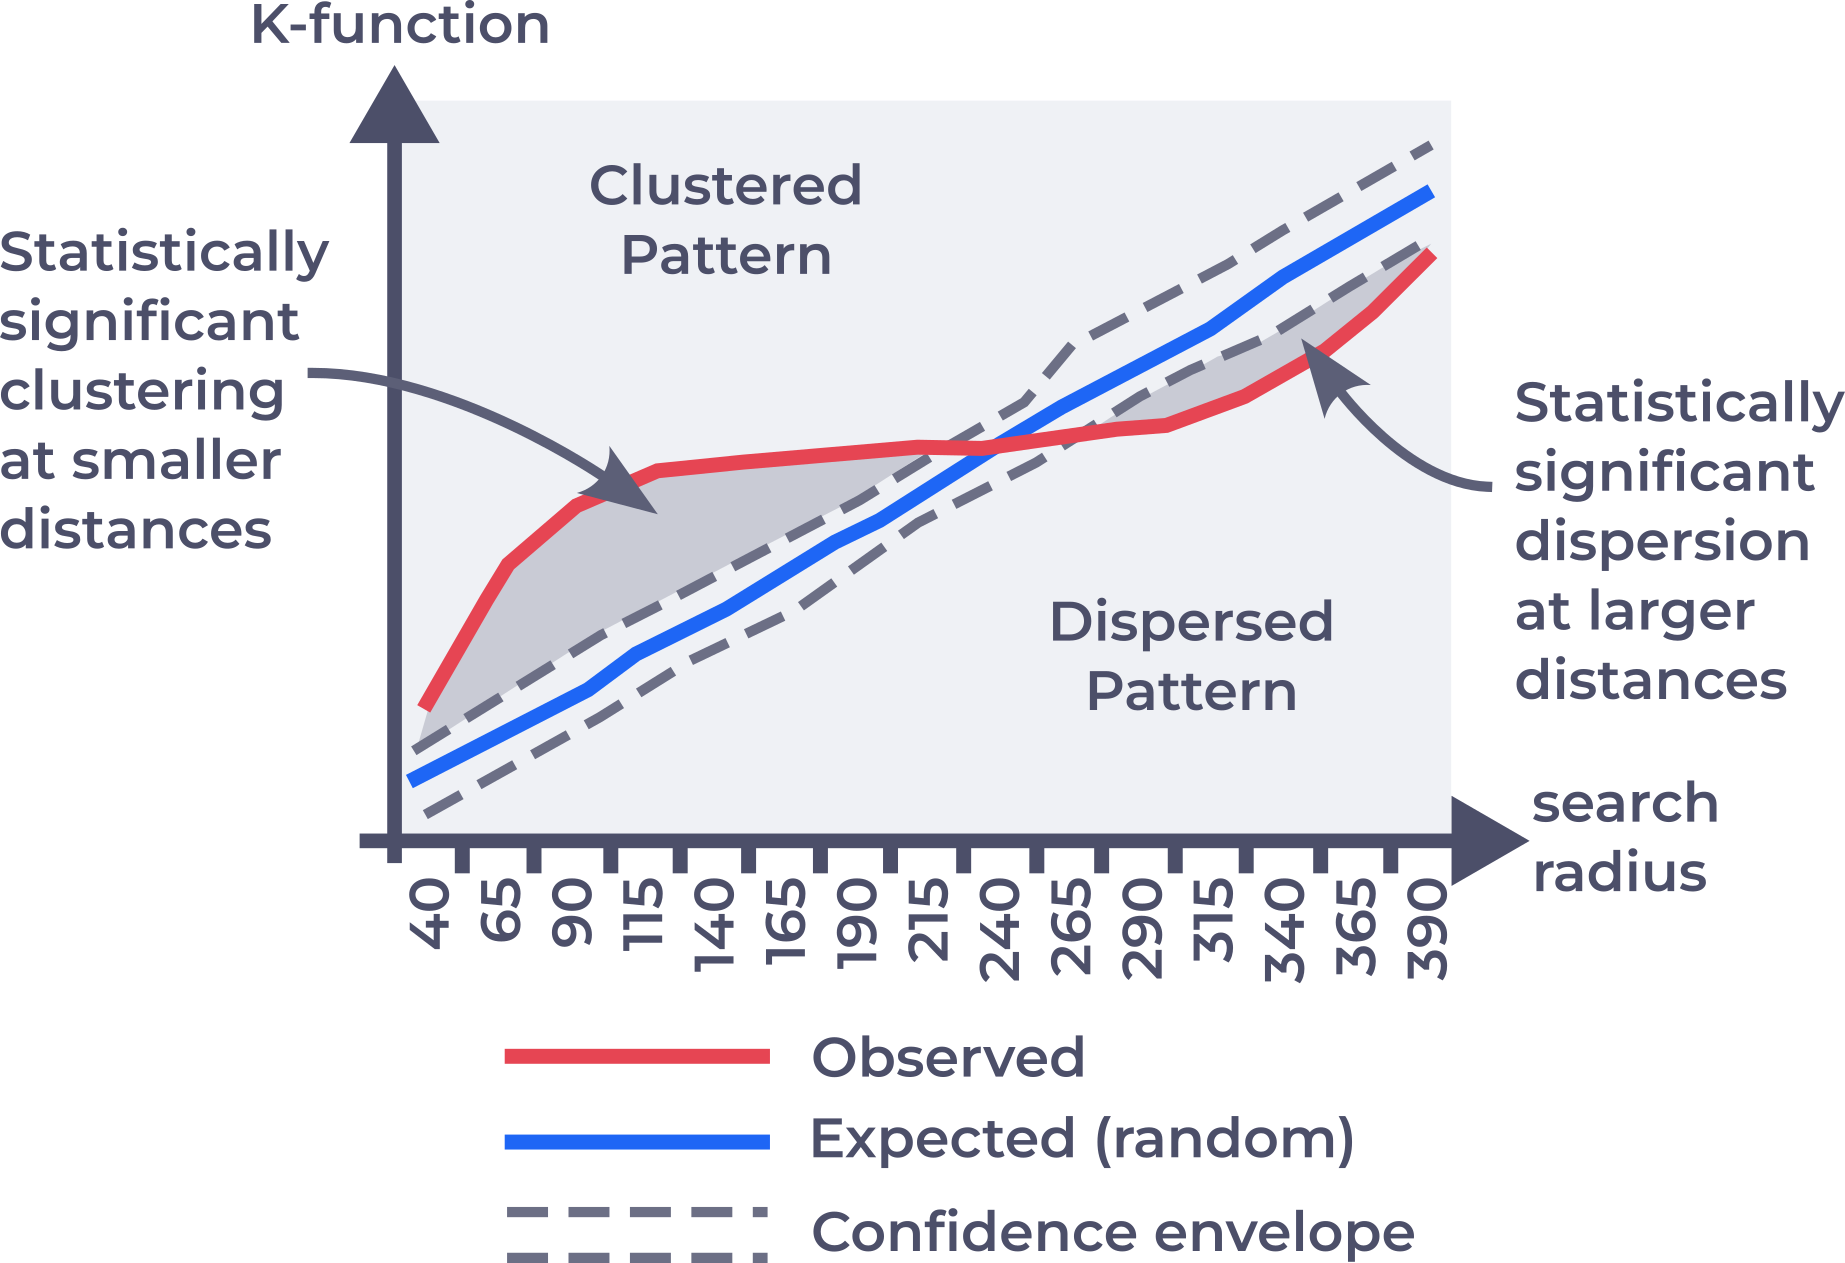
The clustered and dispersed range of K-function curve.
For demonstration: 10 random patterns are generated
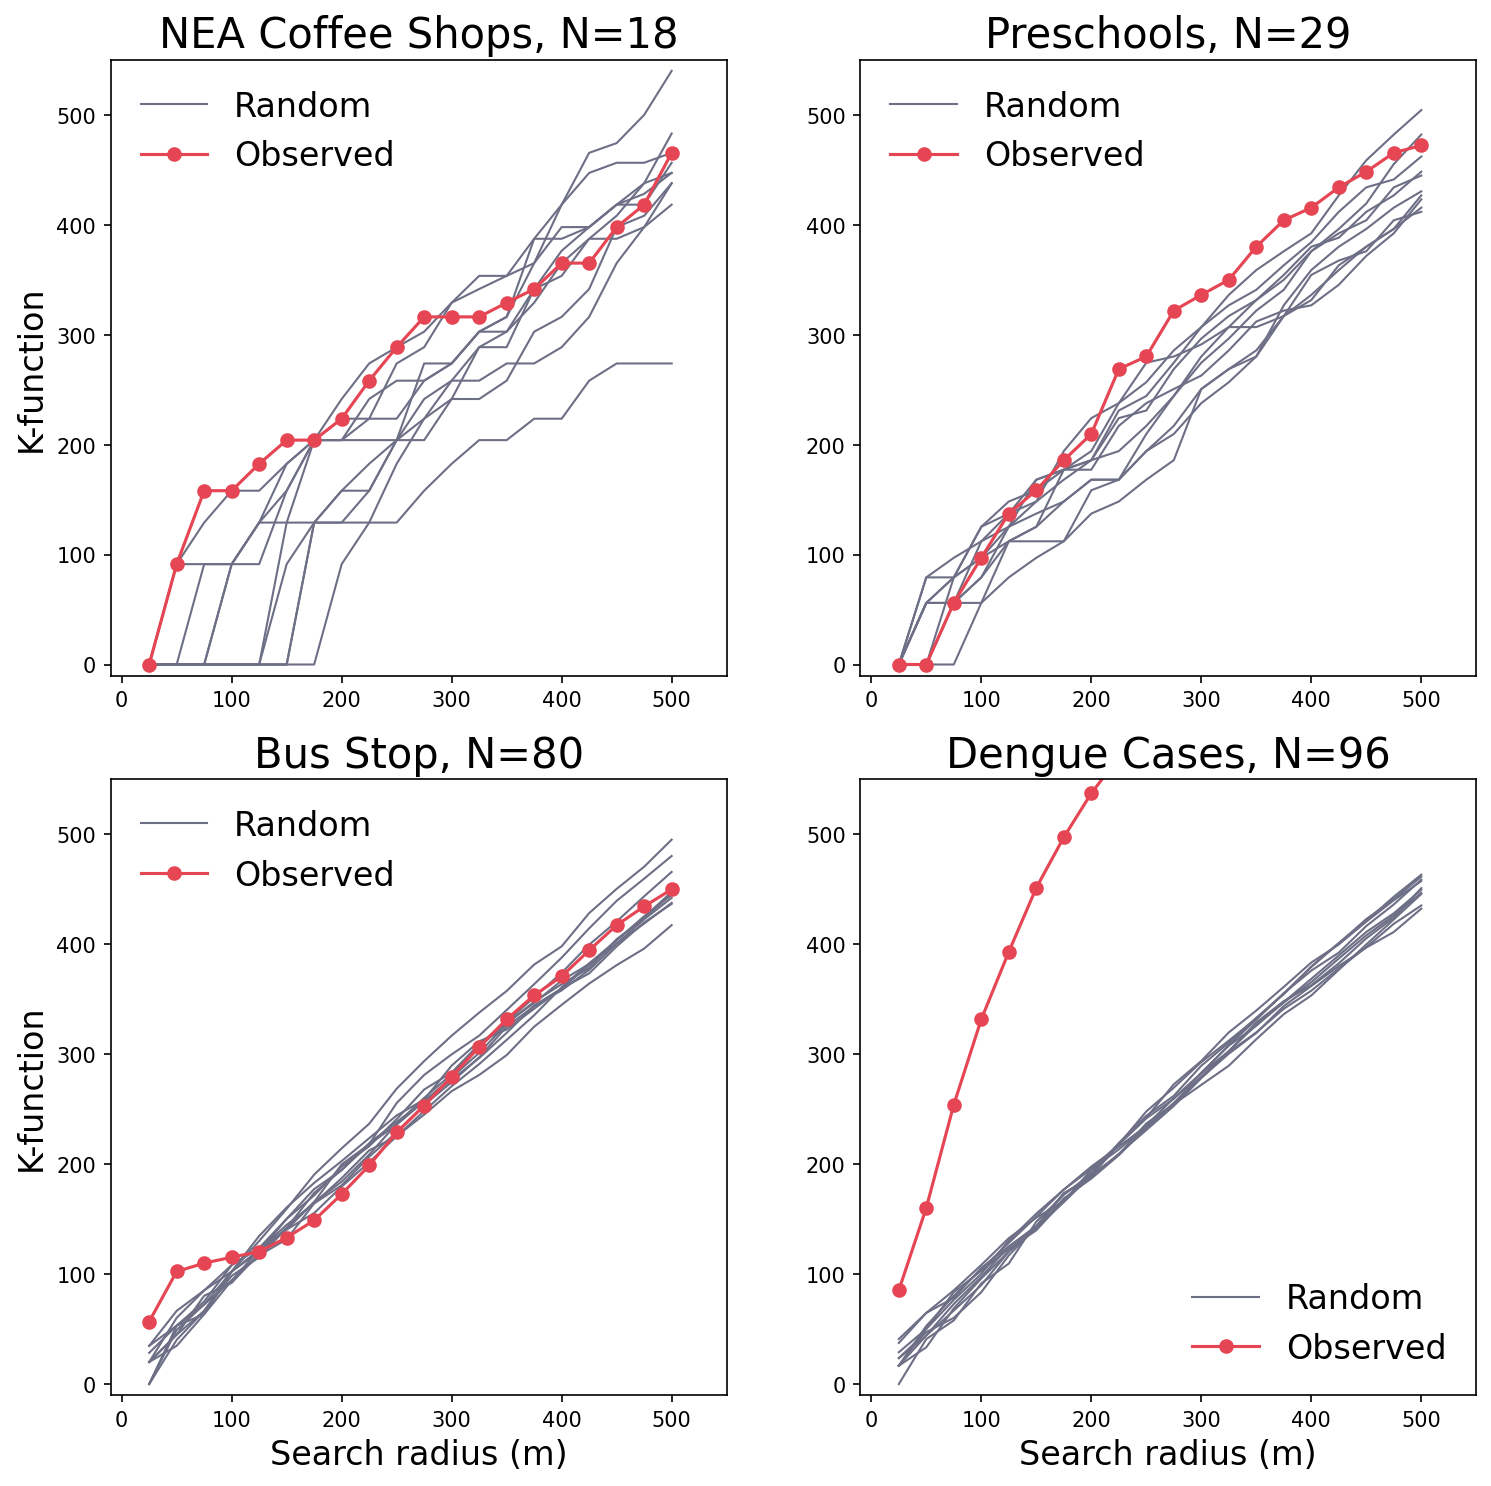
K-function curve of the four examples and the k-function curves of the corresponding 10 random distributions.
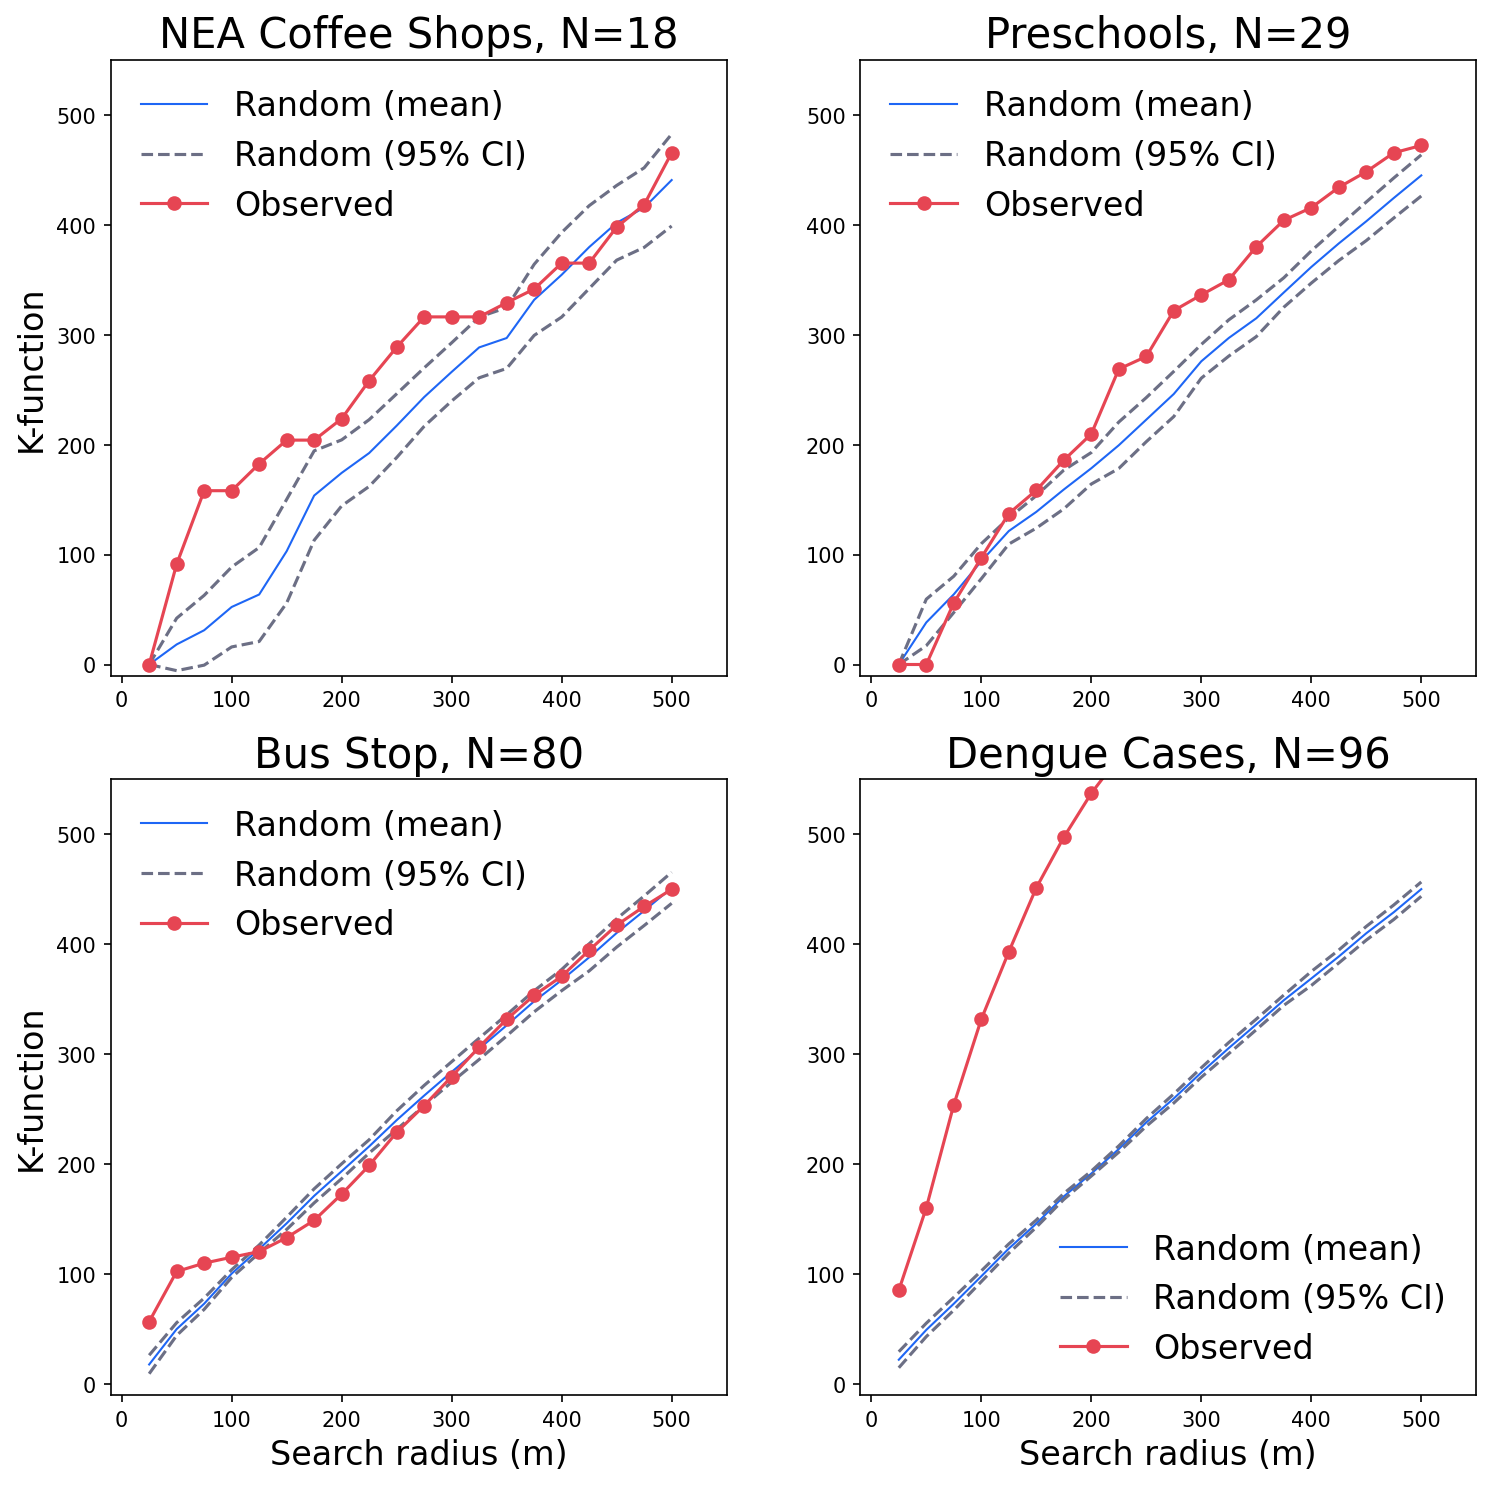
Calculate 95% Confidence envelop. See ESRI for more details.
The k-function curves and the confidence interval (Monte Carlo Simulation) for the 4 examples.
Comparison between NNA and K-function results
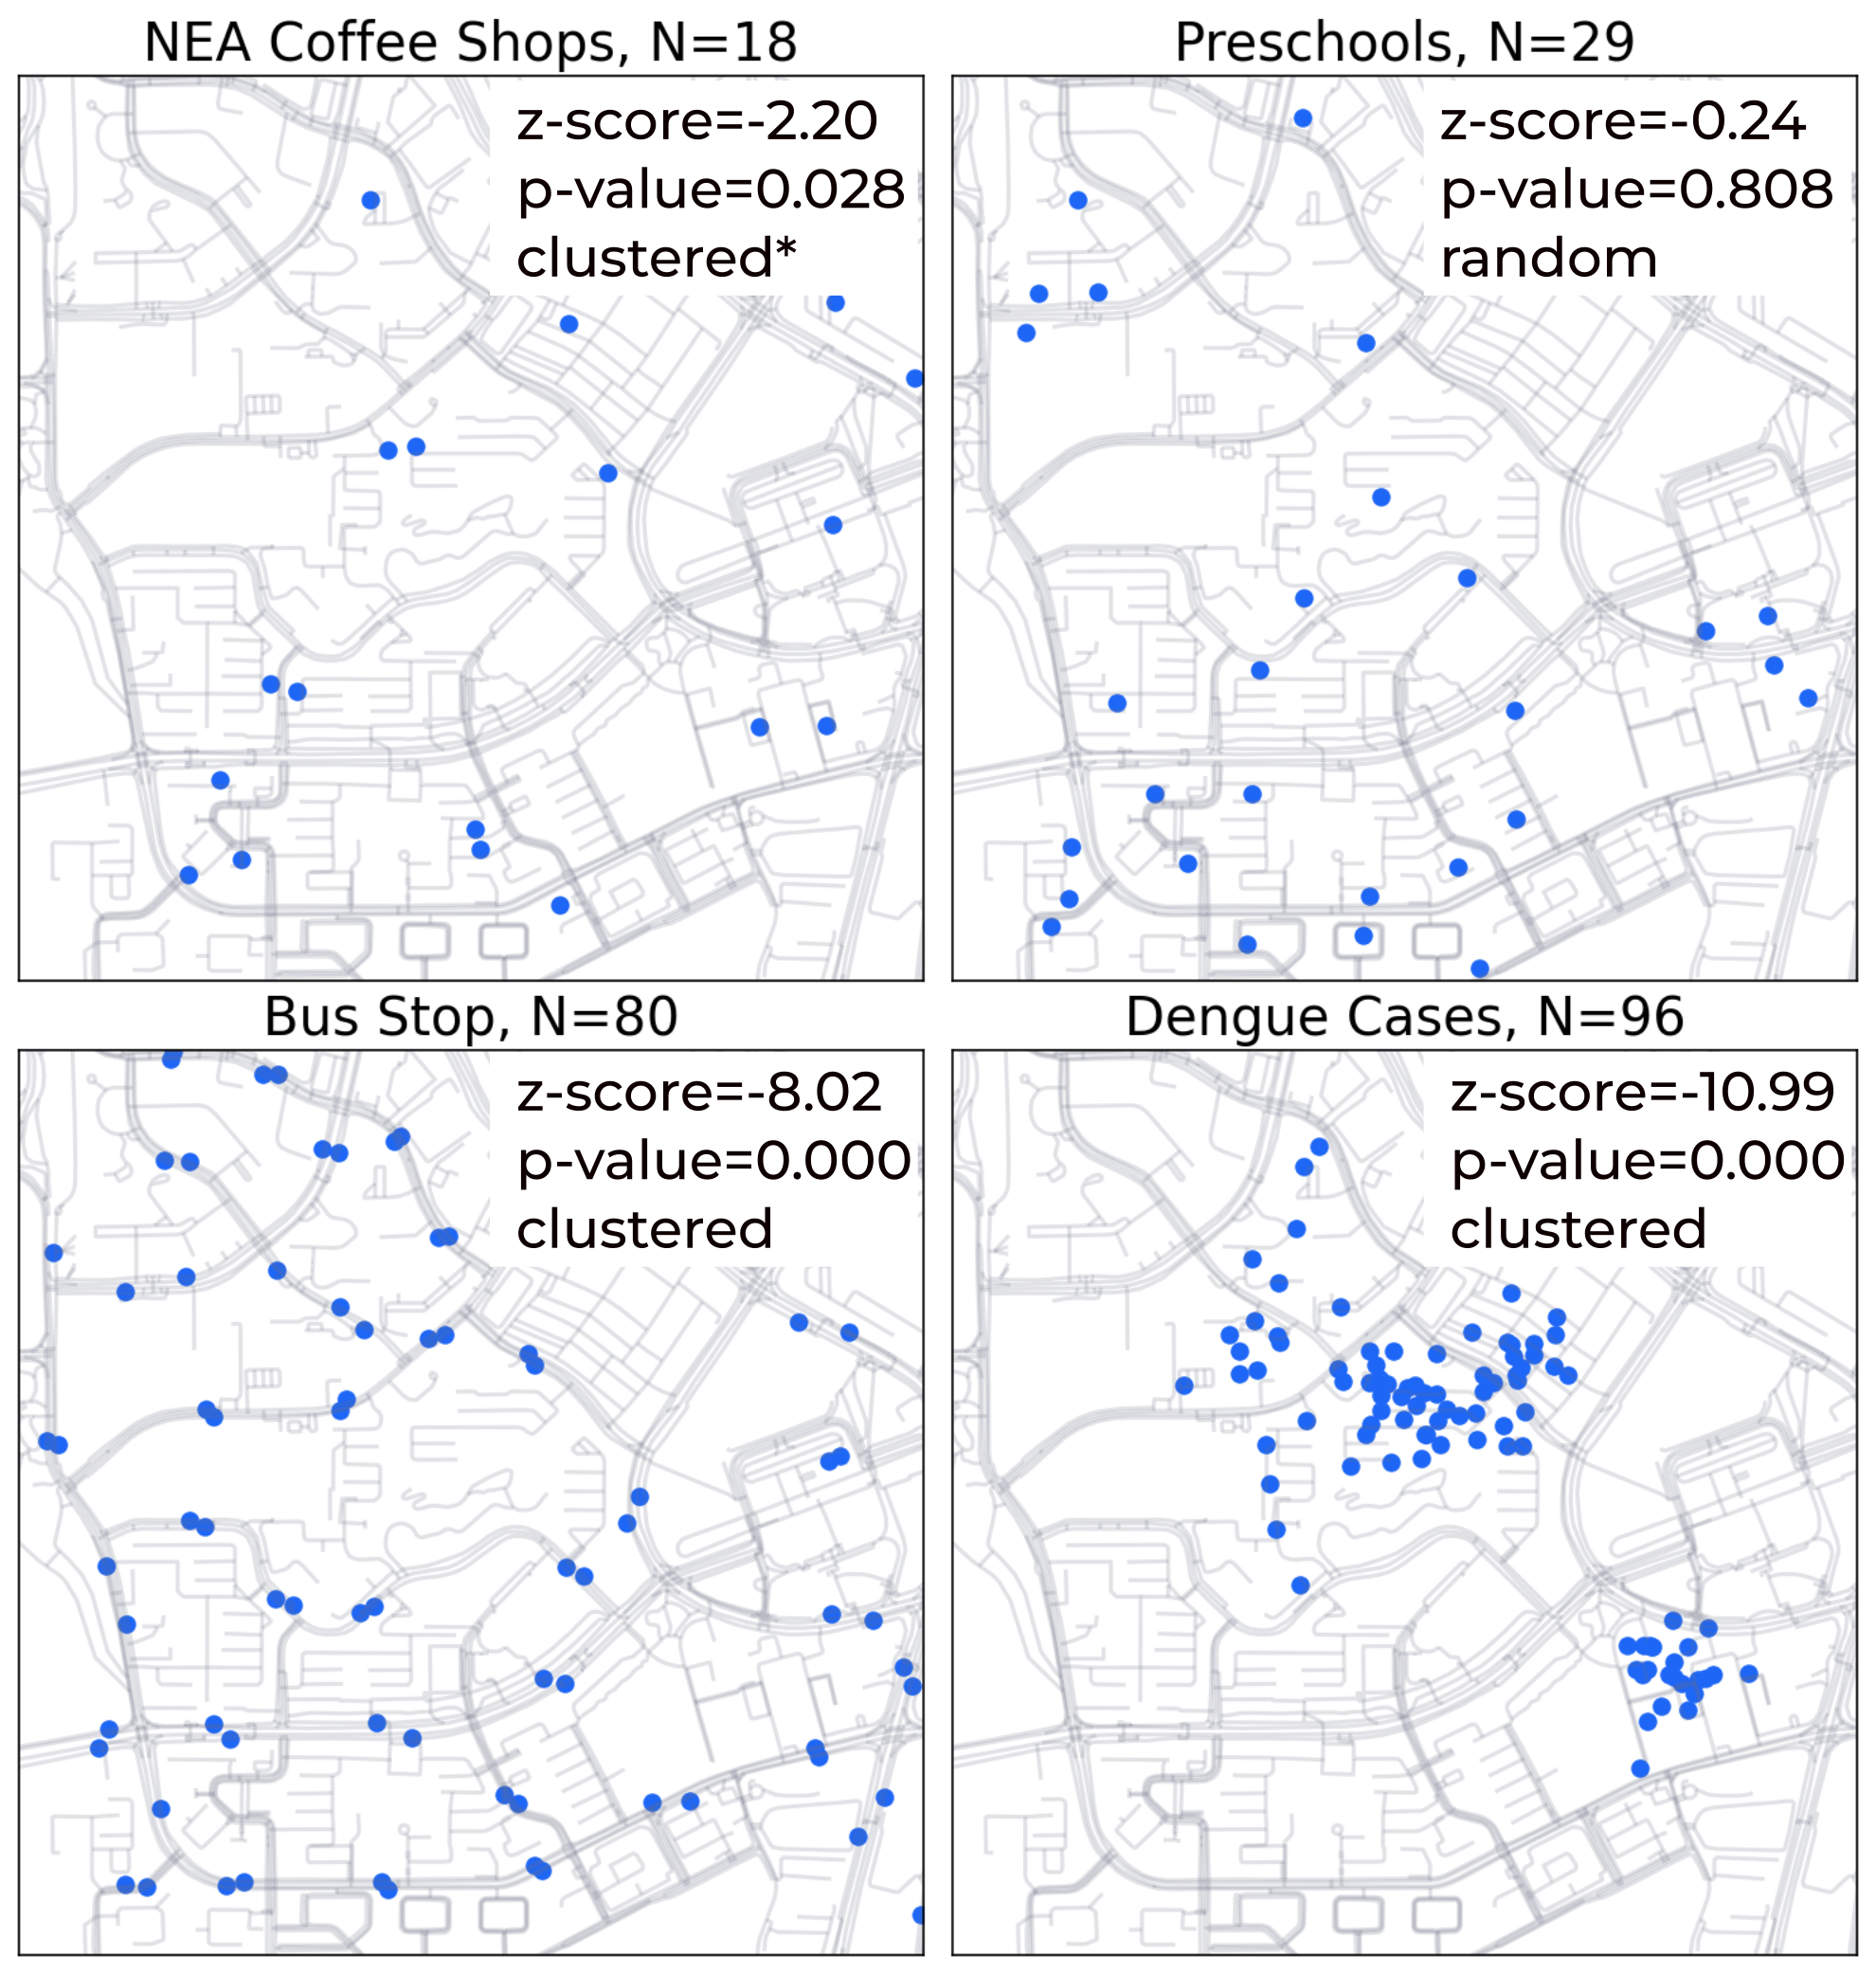
(a)Nearest Neighbor Analysis
(b)Ripley's K-function
Figure 7:The results for the 4 examples using two methods.
Summary: Repley’s K-function
Purpose
Ripley’s K function is a tool used to analyze spatial point patterns, helping researchers understand the spatial relationships among events or objects in a given study area.
Functionality
The K function estimates the expected number of points within a given distance from a randomly chosen point, providing insights into clustering, dispersion, or randomness in the spatial pattern.
Key features
The K function can be plotted as a function of distance to visualize changes in spatial interactions at different scales.
It can be compared with theoretical models, such as complete spatial randomness (CSR), to assess deviations from expected patterns.