Objectives of this lecture
To locate where the clusters are.
To differentiate spatial clusters.
What was covered in previous section
Point Patterns
Complete Spatial Randomness
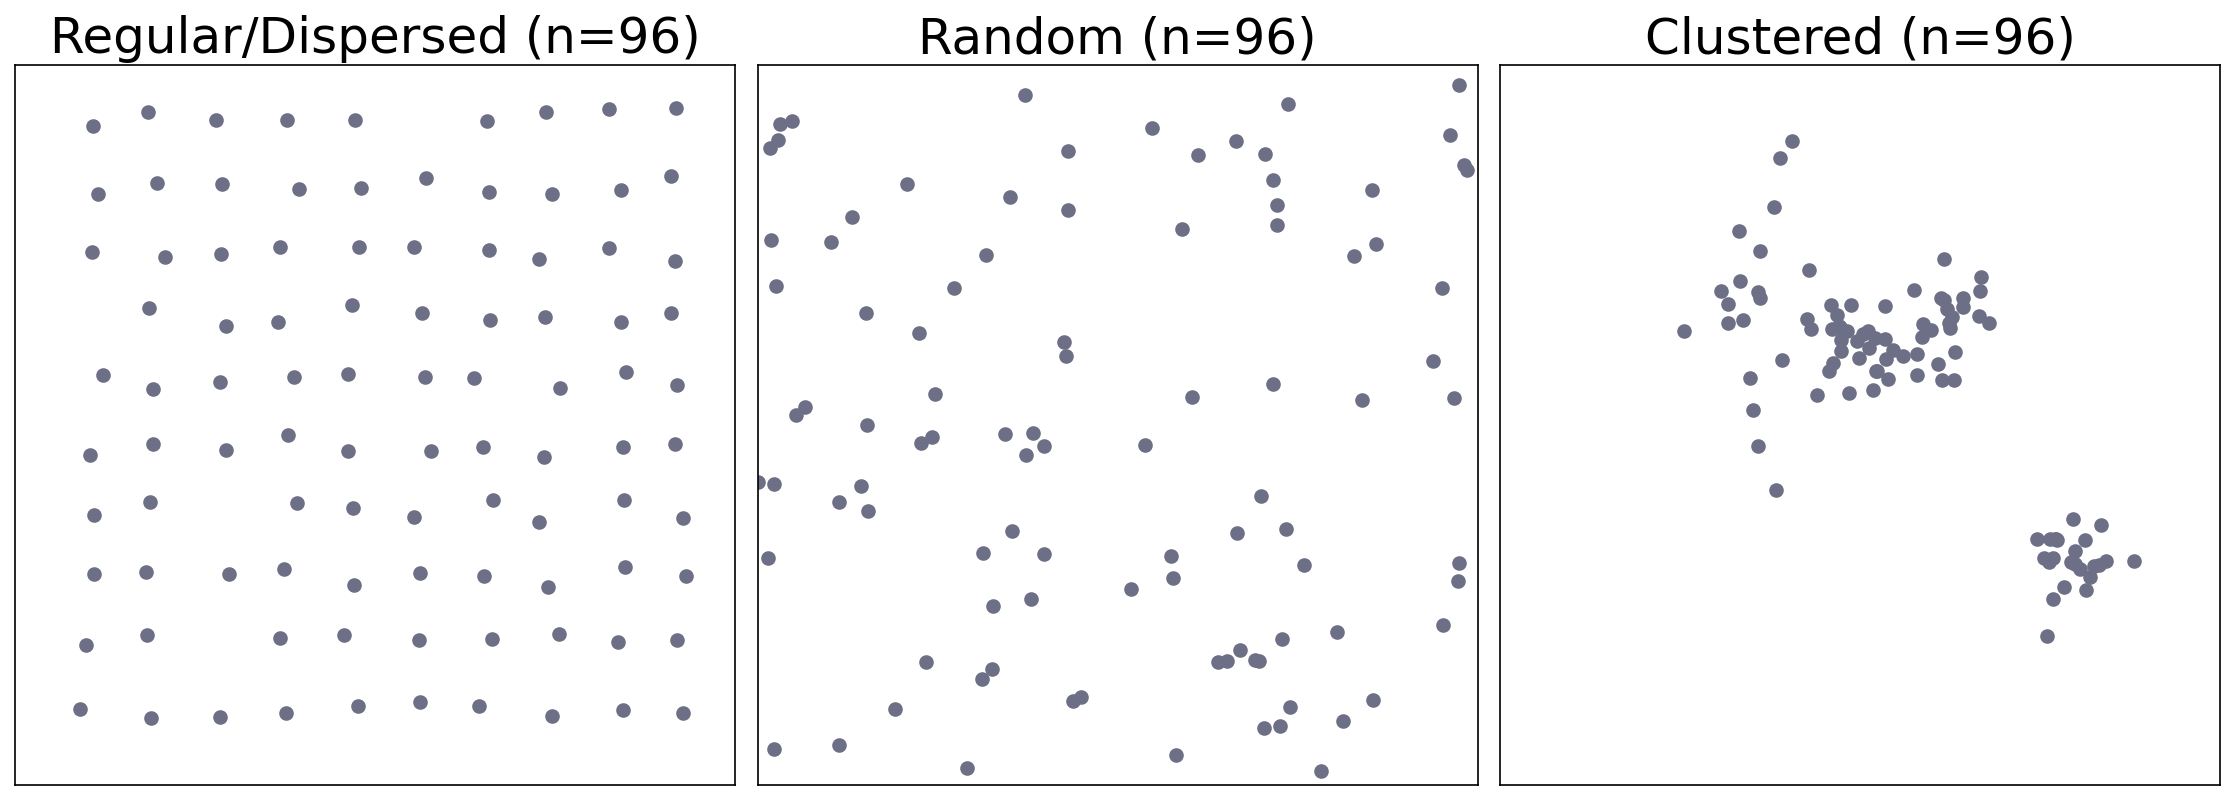
Methods for differentiating various types of point patterns:
clustered,
random,
dispersed
The main purpose and testing hypothesis is: Does the entire/overall pattern of point data present some sort of non-random pattern?
It does not answer WHERE the pattern occurs.
Global Analysis and Local Analysis
Terminology: The term ‘GLOBAL’ refers to the scale of analysis, which encompasses the entire study area, rather than implying an analysis at the Earth’s scale.
Holistic perspective: Global analysis provides an overall view of the spatial patterns or trends across the entire study area, enabling a comprehensive understanding of the phenomena under investigation.
Is the crime incidences clustered within the study area?
Spatial autocorrelation: Global analysis can detect global spatial autocorrelation, a measure of how similar or dissimilar the values of a given attribute are in nearby locations.
Do places with more crime incidences near to other places with more crime incidences?
Spatial heterogeneity: It helps identify global spatial heterogeneity, or the variation of a given attribute across the study area, providing insights into the distribution patterns of the phenomena.
Is the crime rate similar across the study area?
Is the crime rate (non-)uniform within the study area?
Modeling and prediction: Global analysis aids in developing statistical models and predictions for the entire study area by incorporating spatial autocorrelation and heterogeneity into the analysis.
Scale considerations: The results of global analysis may depend on the scale or resolution of the study area, highlighting the importance of selecting appropriate spatial scales for the analysis.
Global Analysis
Think of a regression model---any model. Would you focus on a single data point or a subset of data points?
In most cases, when working with regression models, we do not focus on the characteristics of a single or a few individual data points. Instead, we pay attention to the overall ‘pattern’ that emerges when considering the entire dataset. This pattern allows us to calculate crucial components such as regression coefficients (), their significance, and relevant statistical tests like , pseudo , AIC, and others.
By examining the collective behavior of the data points, we can gain insights into the underlying relationships between variables, assess the model’s performance, and make informed predictions or decisions based on the model’s output. In other words, a ‘global’ understanding of the entire dataset.
Is it clustered? not-clustered? random?
Local Analysis
As geographers, we are not satisfied with the global understanding, we also want to know ‘where’.
What is Local Analysis
Local pattern: Local analysis focuses on identifying patterns or trends within specific local areas or neighborhoods in the study region.
Spatial Heterogeneity: It explores spatial variations by examining how a given attribute behaves differently across various locations in the study area.
Identification of location: Local analysis is crucial for understanding the nuances of spatial data and identifying specific regions that require targeted interventions or further investigation.
Key aspects of local analysis include:
Detection of local clusters: Identifying regions with high or low concentrations of a given attribute, also known as hot spots and cold spots, respectively.
Local spatial autocorrelation: Evaluating how similar or dissimilar the values of a given attribute are in nearby locations within specific local areas.
Scale-dependent patterns: Investigating how local patterns change with different spatial scales or resolutions.
Finer details: Local analysis complements global analysis by providing insights into the finer details of spatial patterns and helping to develop more targeted strategies and solutions for different parts of the study area.
The aim of local analysis in geospatial visualization and statistics is to identify local patterns and spatial variations by examining how a given attribute behaves differently across various locations in the study area. This includes understanding the interaction between nearby spatial units and detecting clusters or hot spots where the concentration of the attribute is significantly high or low compared to the surrounding areas.
In other words:
Local Spatial Analysis is to answer the question of WHERE are the clusters?
Global Spatial Analysis is about the question of WHAT is the pattern?
Local Analysis - HOW?
Common methods for Local Spatial Analysis include:
Local Indicators of Spatial Association (LISA) for areal data
Local Moran’s I
Local Geary’s C
Local Getis-Ord Gi*
Kernel Density Estimation
Two Types Clusters/Clustering in Spatial Analysis
some parts of the study area that have very high concentration of point events, i.e., ‘clusters’
to check if this phenomenon exists in the spatial point data
to identify the location of these clusters
significant tests, CSR
groups of spatial points that are close to each other, i.e., ‘clusters’
identify grouping of points with/without overlap