A demonstration for chapter 4.

Let’s do a mind travel to Gordon Square, London, UK. Source: Google Map
The question
Can we assume people randomly find a spot to sit?
Can we assume people prefer not to sit too close to strangers?
If they go with friends or colleagues, they will sit together.
Will the process of people finding comfortable spots for sitting in an open space result in a random, clustered, or dispersed pattern?
Analyze with:
individual level
group level
The dataset
This dataset records the location of people sitting on a grass patch in Gordon Square, London, at 3pm on a sunny afternoon.
Area:
Source: R spatstat dataset, Baddeley et al. 2013: DOI:10.18637/jss.v055.i11
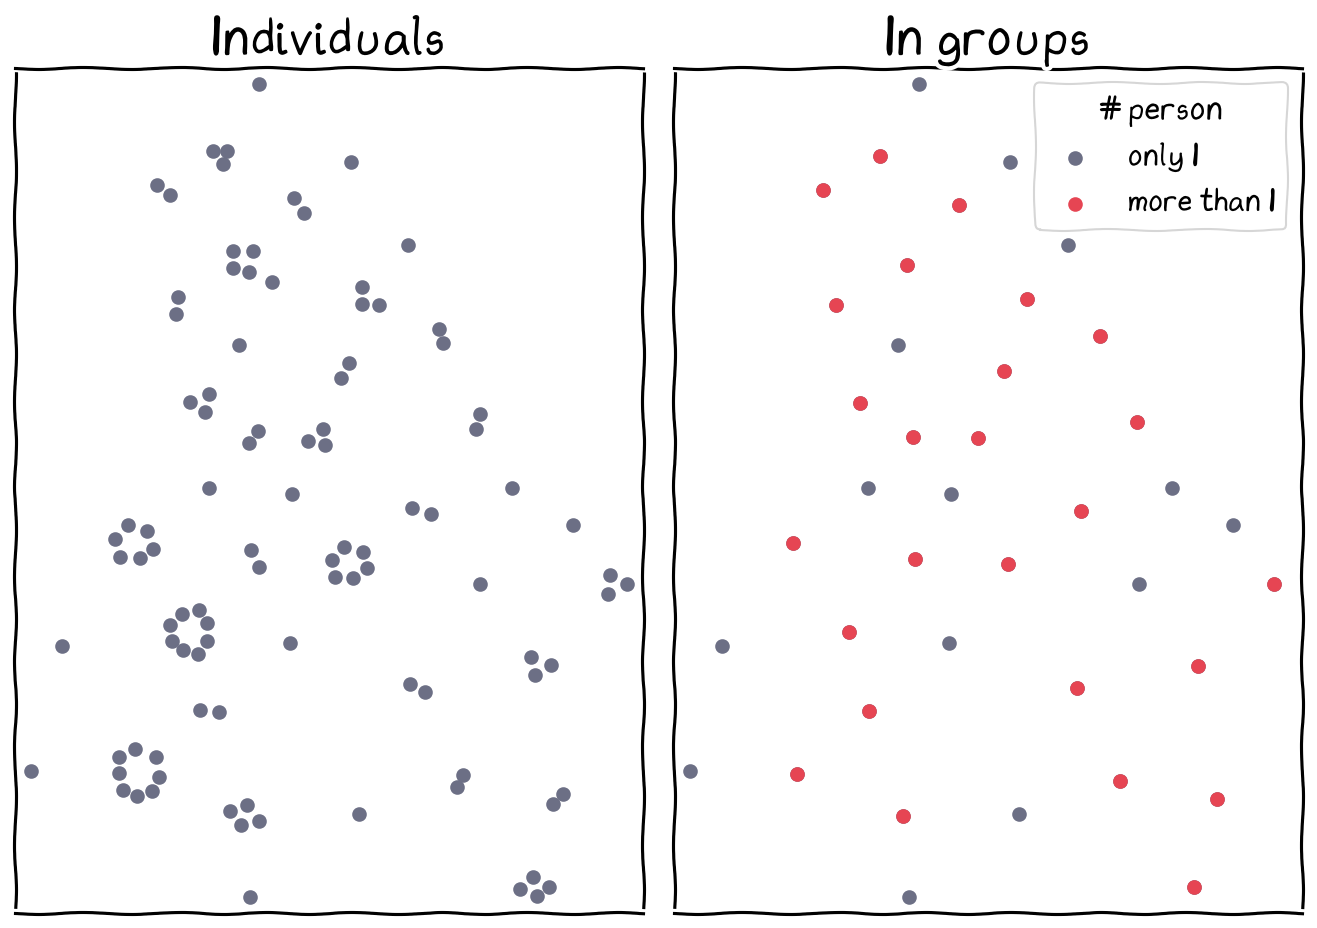
Distribution of individuals and groups.
Nearest Neighbor Analysis
For individual, the p-value is significant with a negative z-score, indicating people tended to sit together.
For in-group, the p-value is significant, with a positive z-score, suggesting the locations of groups are dispersed.
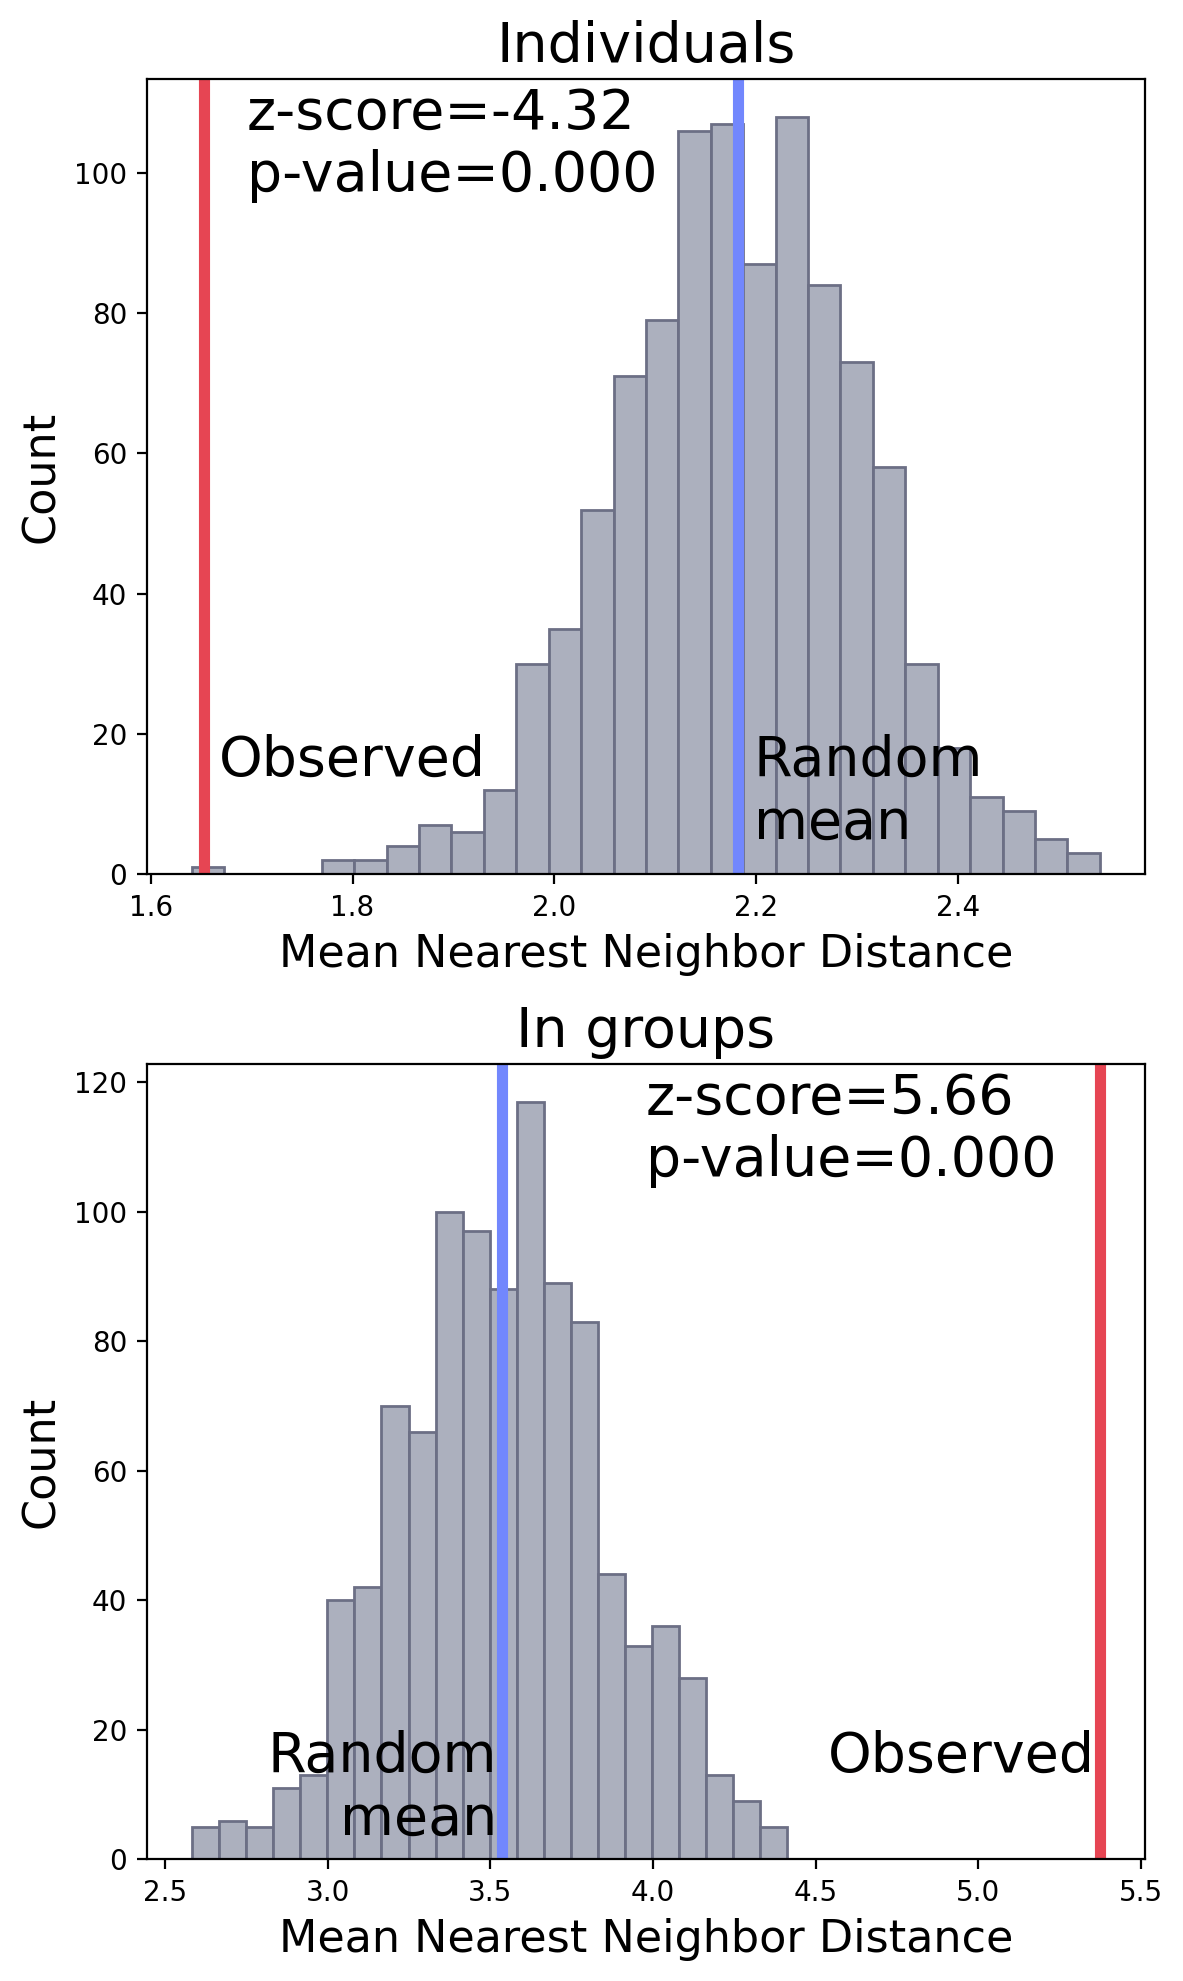
NNA result.
Ripley’s K-function
For individual,
radius 4 m resulted in higher than random, indicating people tended to sit together at this scale.
betwen 4 m and 6 m , the observed line is near to the random, but still above the 95% CI.
For in-group,
the search radius less than 7 m resulted in dispersed pattern.
the search radius beyond 8 m presented random pattern.
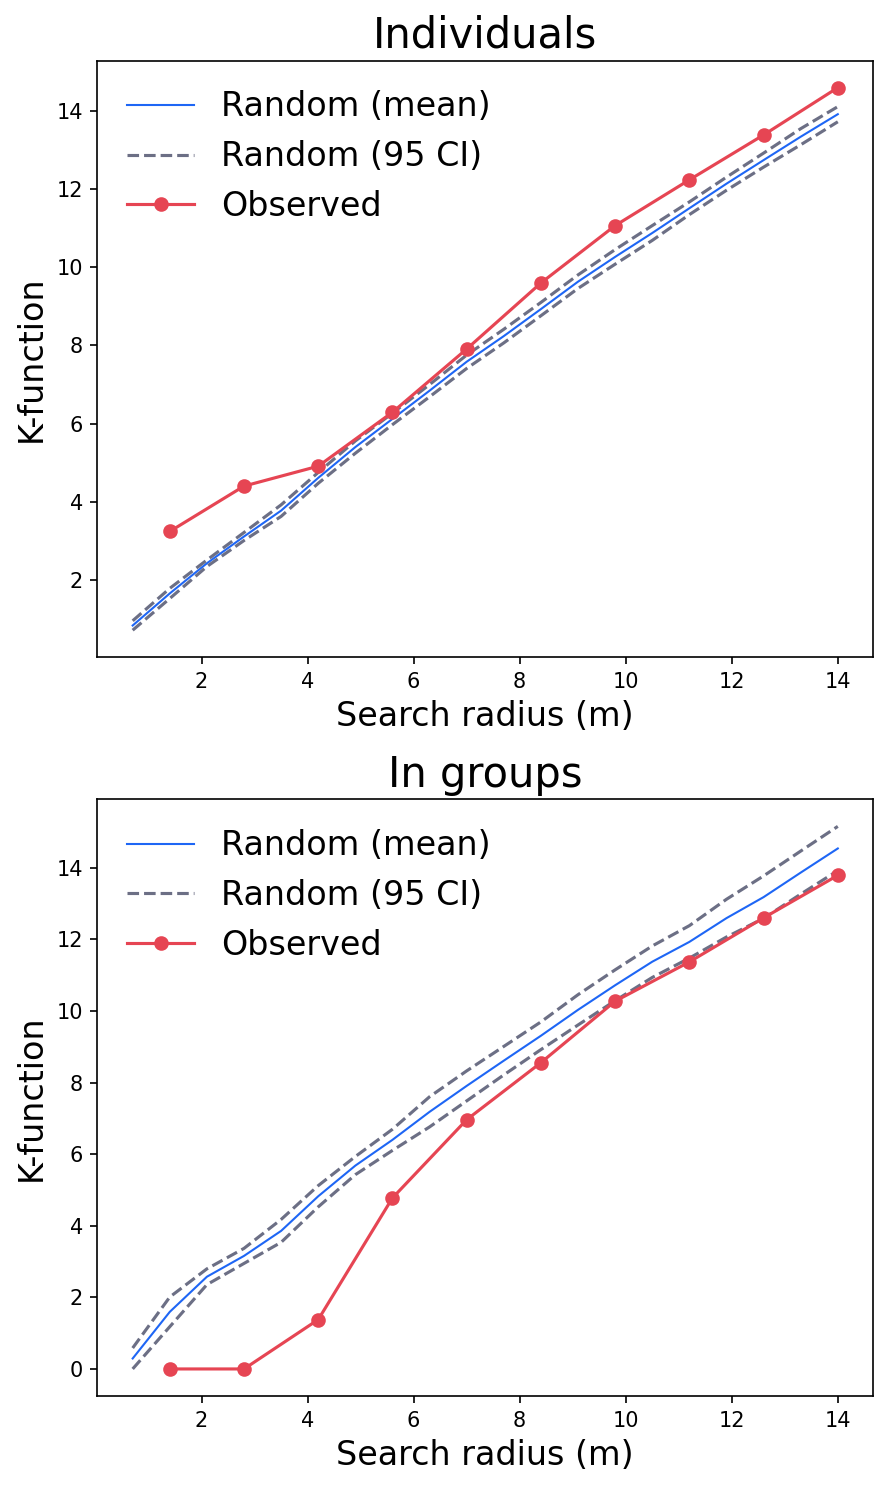
K-function result.
Closing Remarks
NNA & K-function: Key Considerations, Limitations, and Directions
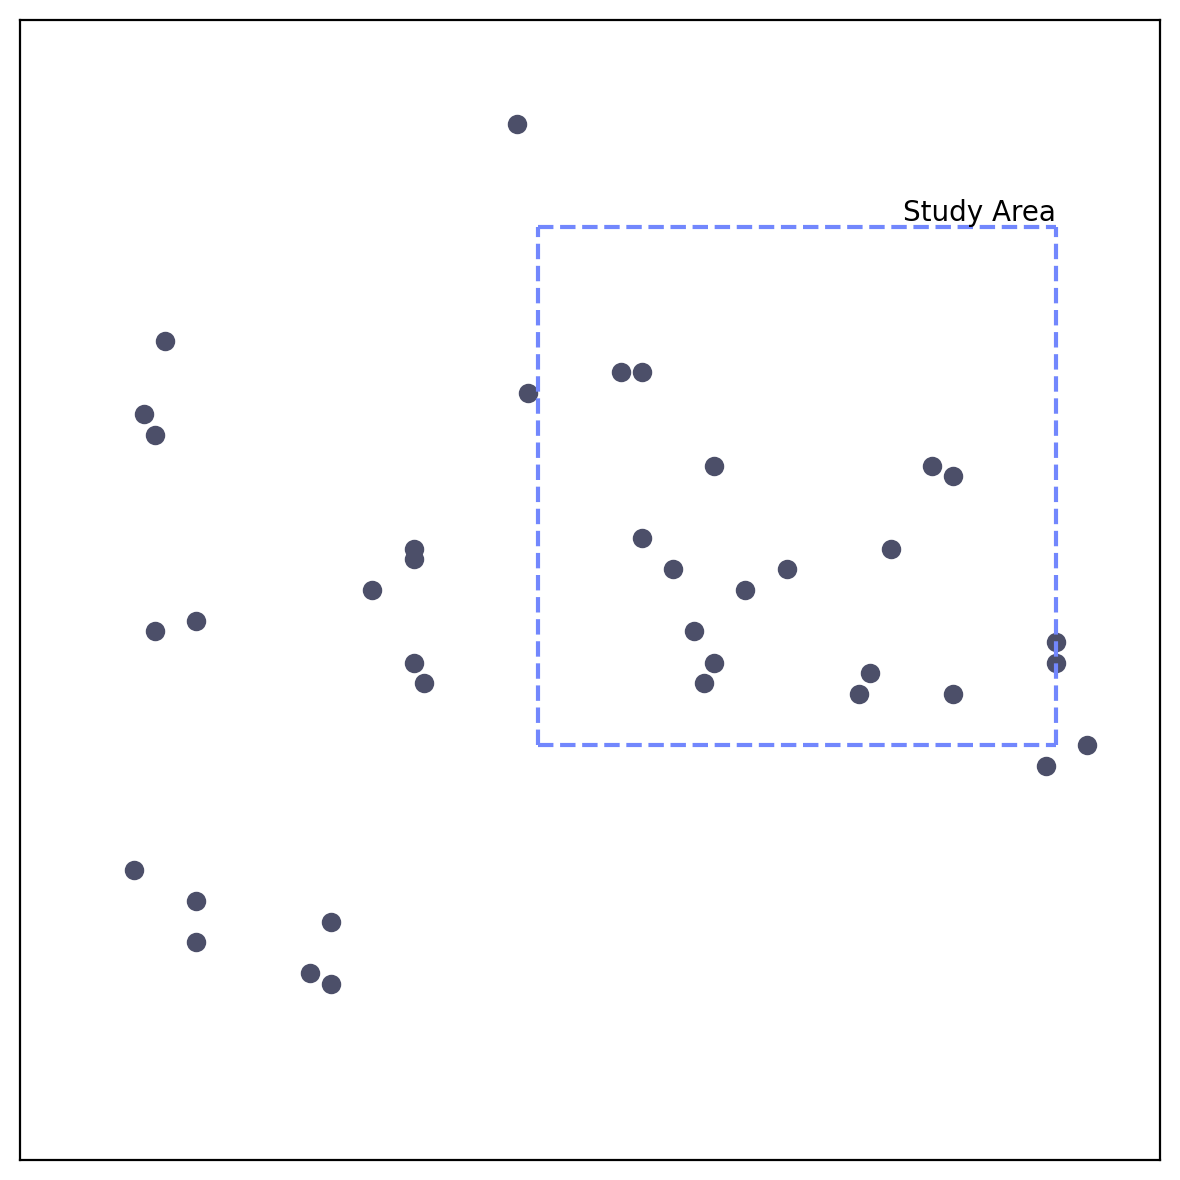
Sensitive to study area size and settings:
CSR assume points to be scattered all around the study area. Thus, Ripley’s K function can be influenced by the size and shape of the study area. Larger study areas may result in different K function estimates compared to smaller ones, and irregular shapes can introduce biases. Additionally, the settings used for the K function analysis, such as the bandwidth or edge correction method, can impact the results.
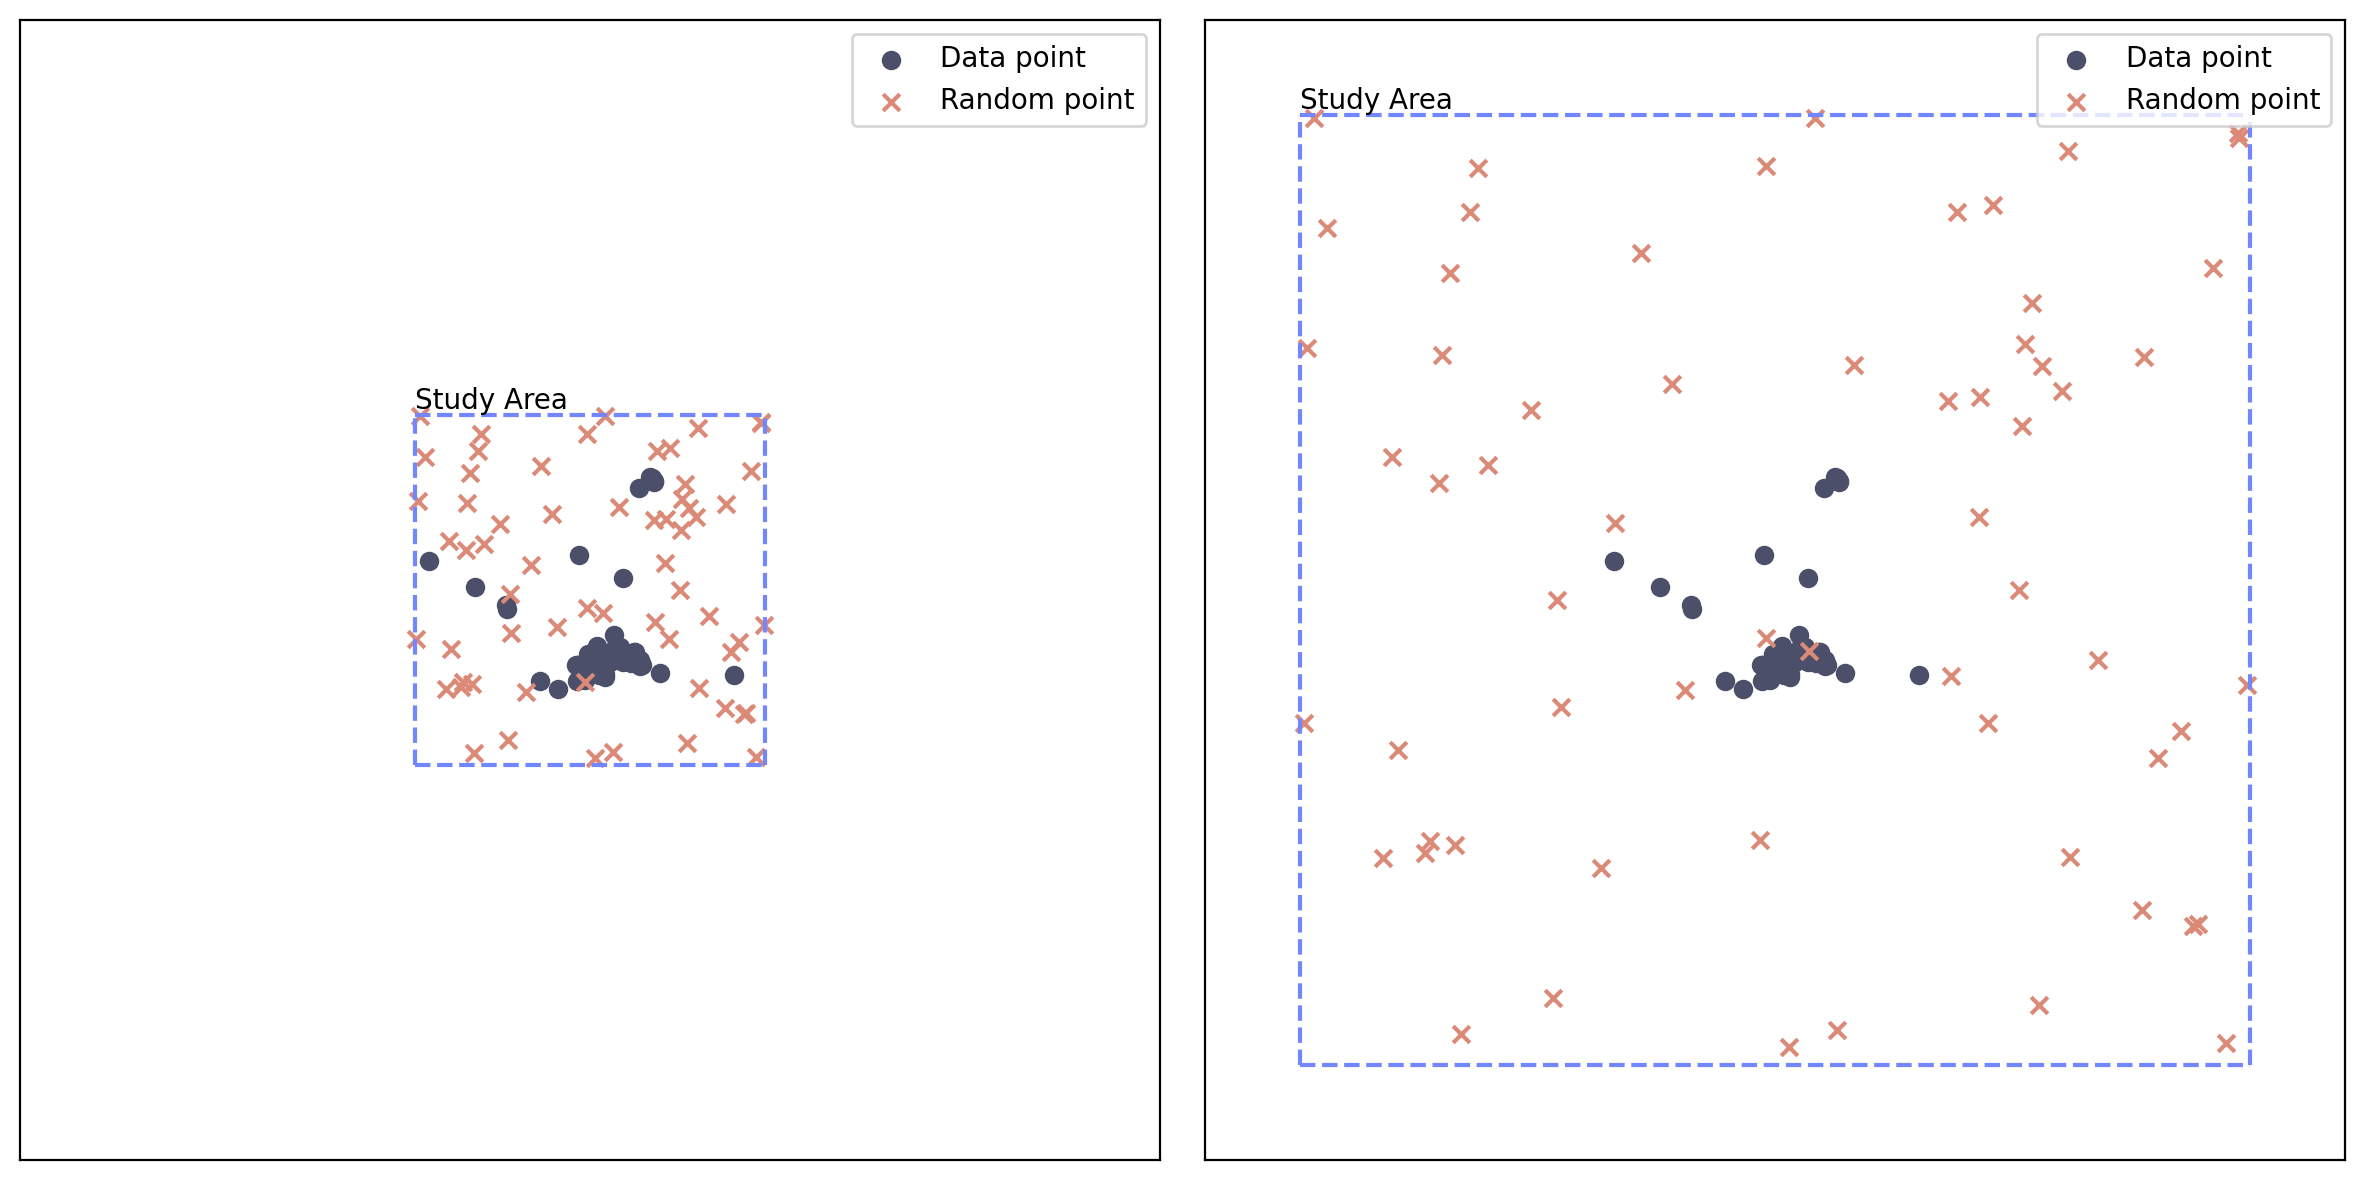
Effect of different area.
Edge effect (border effect):
Points beyond the study area are ‘ignored.’ Points close to the boundary of the study area may have fewer neighboring points than those in the interior, which can bias the K function estimates. This is known as the edge effect, and it can introduce inaccuracies when studying spatial patterns. Edge correction methods are often employed to mitigate this issue.
Edge Effect.
Population-at-risk:
Ripley’s K function assumes that the underlying point process is stationary and homogeneous. If the population at risk (i.e., the underlying risk of events occurring) is not uniform across the study area, this can violate the assumptions and lead to misleading results. Incorporating information on the population at risk can help refine the analysis and improve the accuracy of the conclusions drawn from the K function.

Population at risk.
What has been covered in this chapter and section?
What is the workflow of analyzing spatial point pattern?
Global Pattern: the overall pattern of the point distribution
Local Pattern: where are the clusters
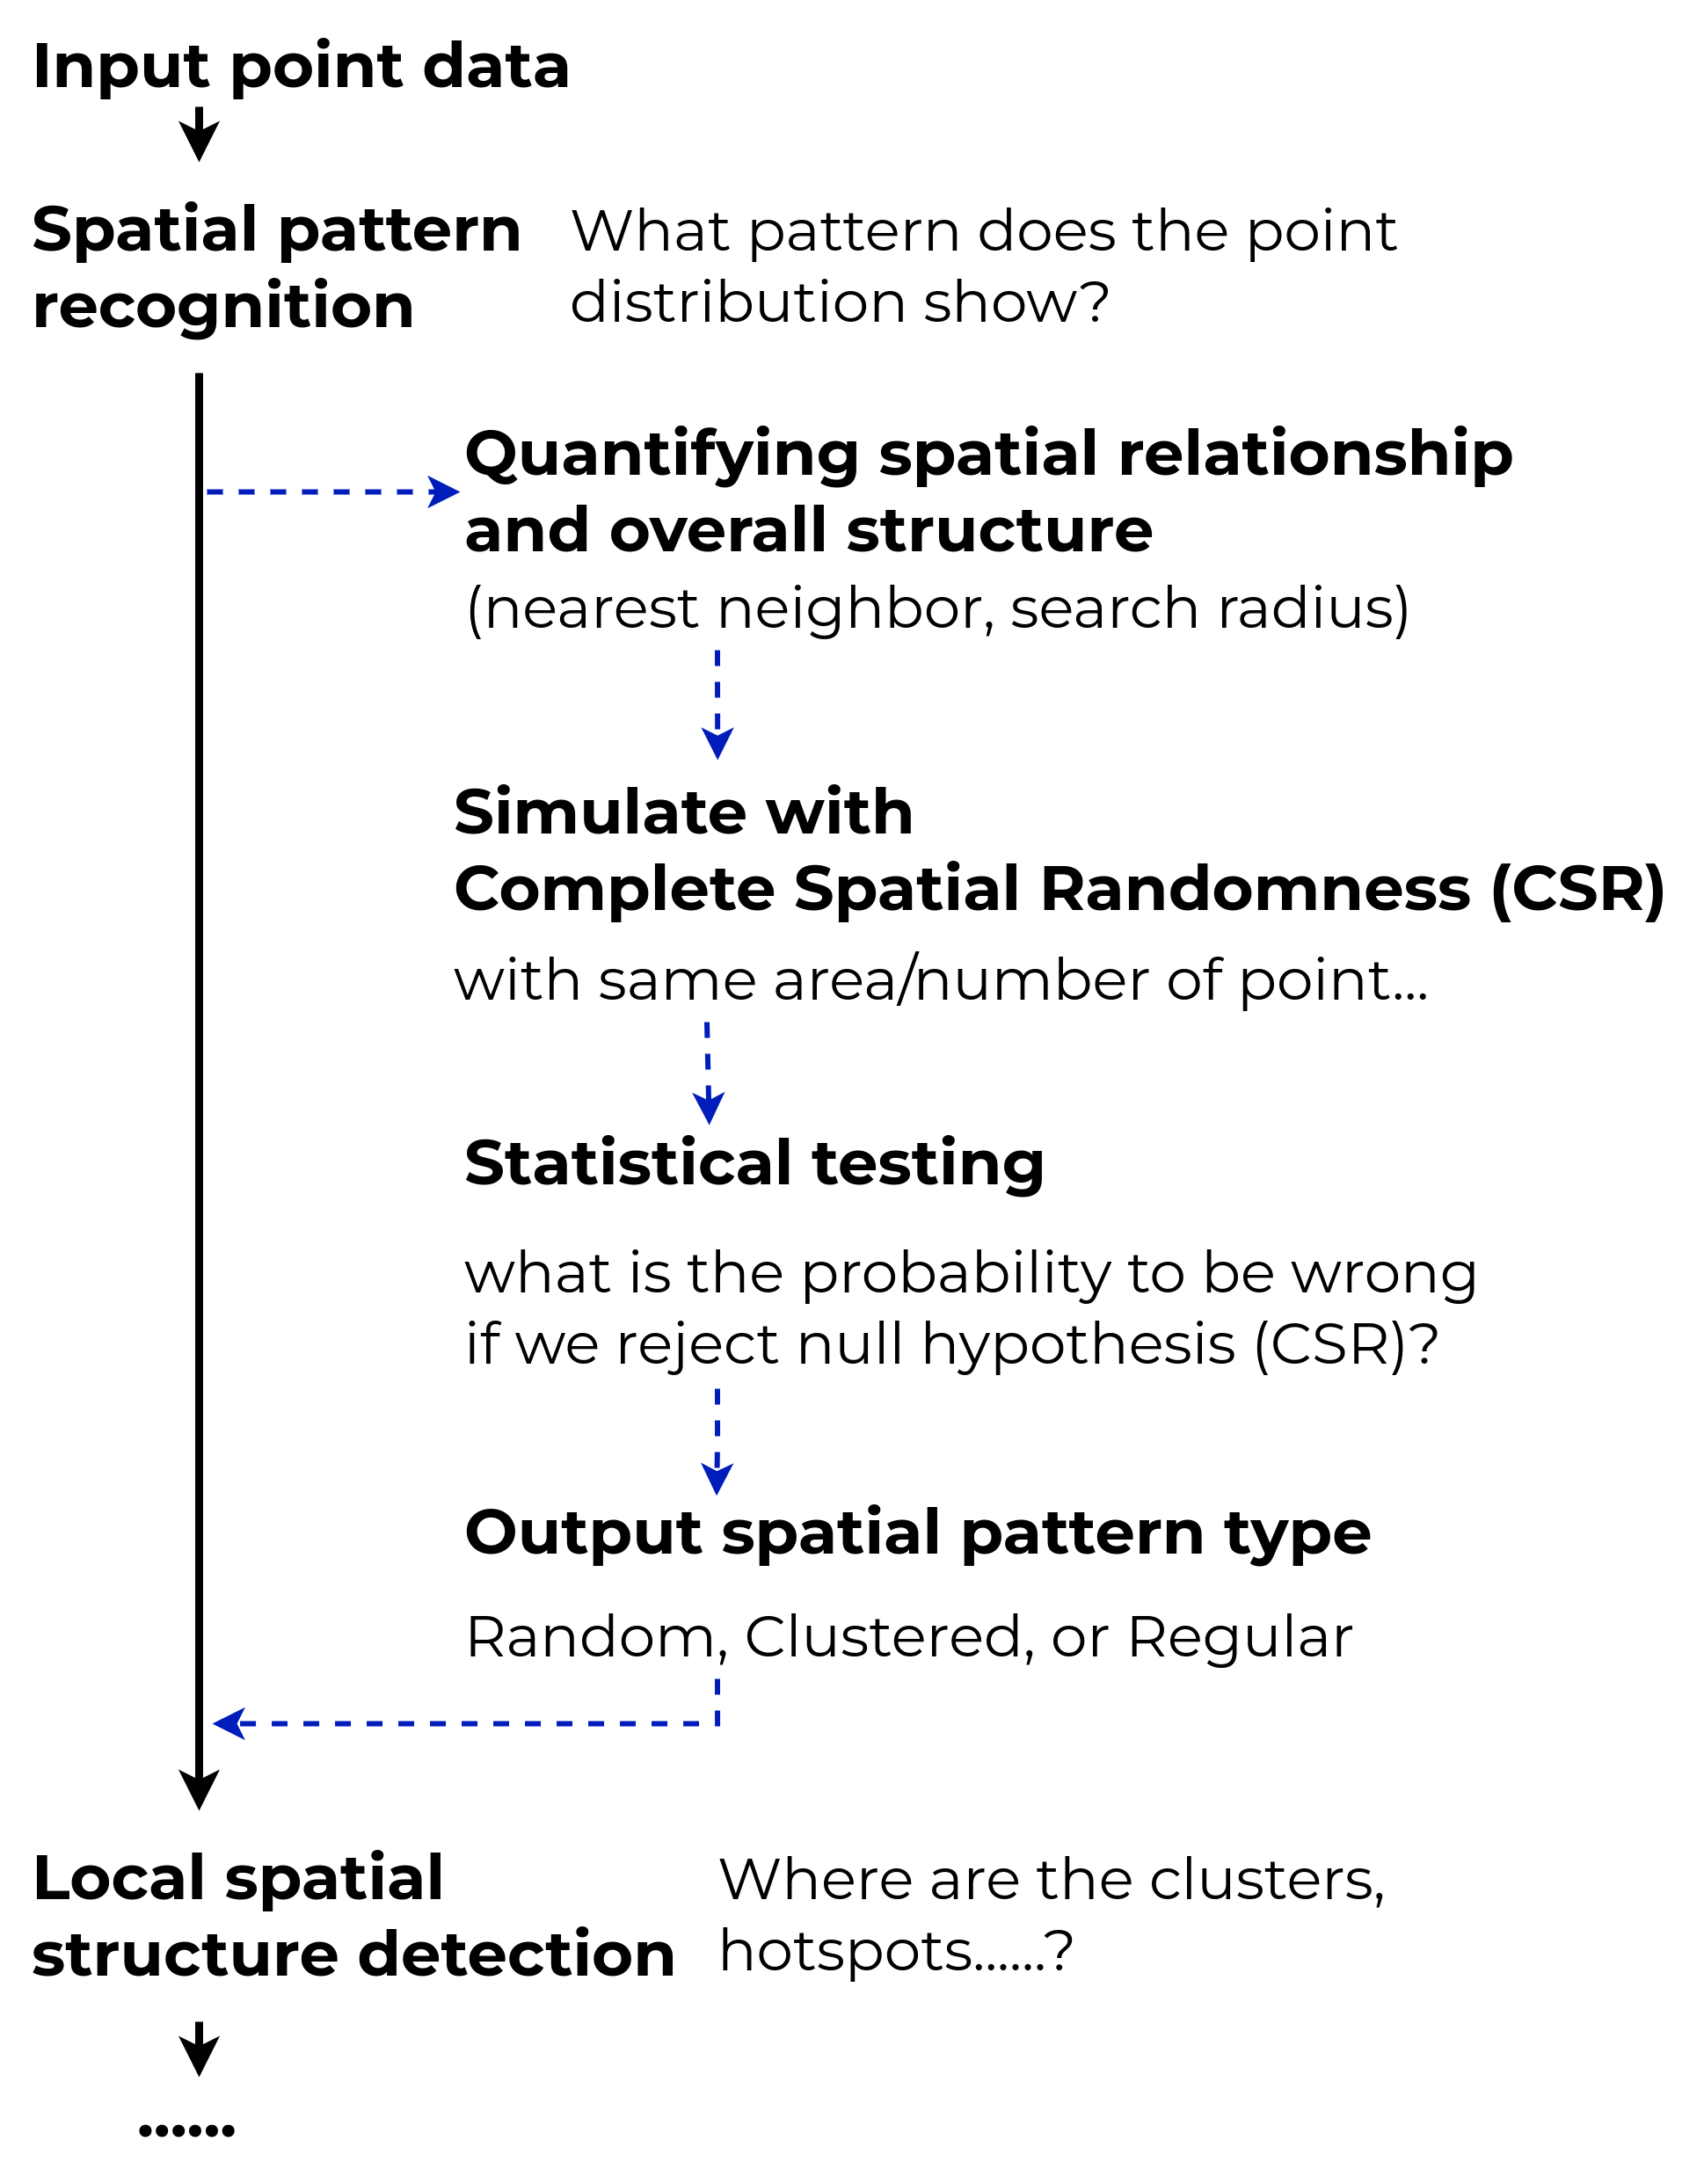
Point pattern analysis.
Some notes
The three methods explore the spatial pattern with different angle:
Quadrat count: the number of points fall in equal size quadrats
NNA: how near/far the nearest neighbor is
K-function: how many other points could be found for a specific search radius
The latter two methods can be extended:
NNA: to k-order nearest neighbor (see: CrimeStat III)
K-function: weighted K-function (see: ArcGIS Pro])
Things to considered:
Edge effect: the near border areas could be underestimated due to the external points. (see: .smaller[DOI:10.2307/3237072])
Population at risk: a place with more population could have more events (e.g., crime/disease cases) happens by chance. (see: SaTScan(https://
www .satscan .org /cgi -bin /satscan /register .pl /SaTScan _Users _Guide .pdf ?todo = process _userguide _download)
About Statistical Tests
There are so many tests. It is more important to know:
The key considerations for choosing a test: Understand the assumptions, requirements, and limitations of each test, as well as the nature of your data and research questions, to select the most appropriate test.
Knowing these can help you to choose the appropriate test(s).
What you’re testing and why: Be clear to yourself about the null and alternative hypotheses, the rationale behind them, and the implications of your results.
Are you testing against CSR? Why?
Explicitly communicate your approach: you have to explicitly tell your readers what, why, and how.
Don’t let your readers guess.
No single test is suitable for all situations, and it’s impossible to memorize every test. Instead, focus on developing a strong foundation in statistical concepts and knowing where to find relevant information when selecting the appropriate test for your specific needs.
About p-value
p-value can only tell you how much risk you need to take if you reject H0.
the common practice is to check if p-value , and common alpha values are:
0.05 for 95% confidence,
0.01 for 99% confidence, and
0.001 for 99.9% confidence.
If p-value is less than the pre-determined , then it is significantly different.
That’s how far you can get with p-value---don’t over-interpret the p-value.
Comparing p-values can be problematic, because they may be calculated from different settings, e.g., sample size.
- Baddeley, A., Turner, R., Mateu, J., & Bevan, A. (2013). Hybrids of Gibbs Point Process Models and Their Implementation. Journal of Statistical Software, 55(11). 10.18637/jss.v055.i11
- Goreaud, F., & Pélissier, R. (1999). On explicit formulas of edge effect correction for Ripley’sK‐function. Journal of Vegetation Science, 10(3), 433–438. 10.2307/3237072