Density-Based Spatial Clustering of Applications with Noise (DBSCAN)
What is DBSCAN?
The algorithm finds dense areas and expands these recursively to find dense arbitrarily shaped clusters.
Two main parameters to DBSCAN are ‘Epsilon (ε)’ and ‘minPoints’.
‘Epsilon (ε, or Eps)’ defines radius of the ‘neighborhood region’ and
‘minPoints’ defines the minimum number of points that should be contained within that neighborhood to be considered as ‘high density’.
The ‘density’ refers to the number of points within Eps, which should be larger than minPoints.
Since it has a concept of noise, it works well even with noisy datasets.
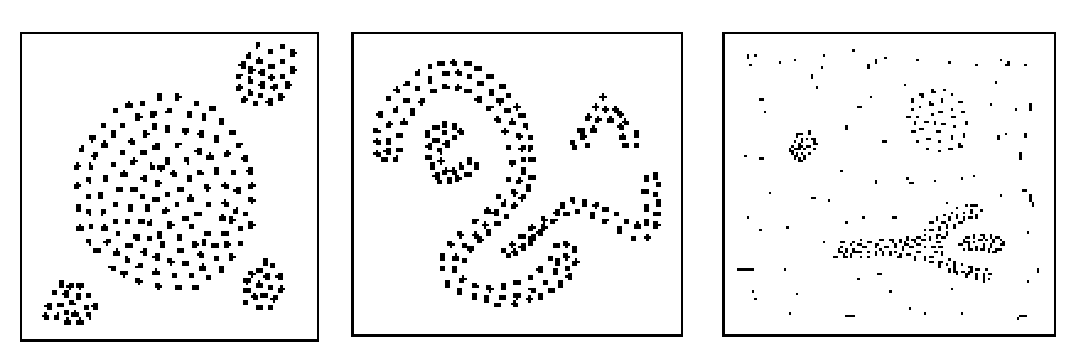
Arbitrary shape clusters
Key concepts
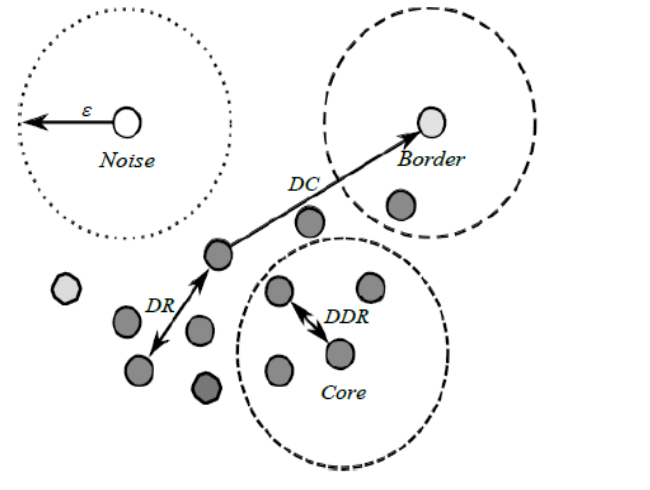
Key concepts of DBSCAN. (minPoint = 4)
Epsilon neighborhood (): set of all points within a distance ‘’.
Core point: A point that has at least ‘minPoint’ (including itself) points within it’s .
Directly Density Reachable (DDR): A point is directly density reachable from a point if is core point and of .
Density Reachable (DR): Two points are DR if there is a chain of DDR points that link these two points.
Border Point: Point that are DDR but not a core point.
Noise: Points that could not reach to any core point through a chain of DDR points.
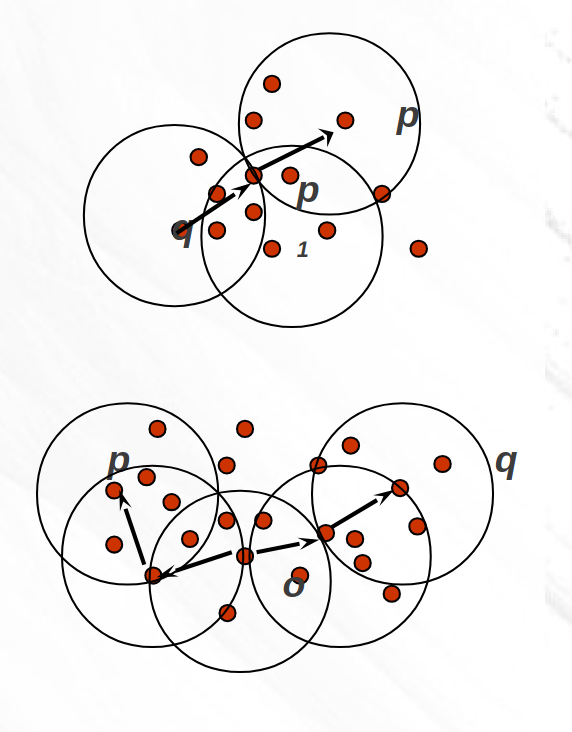
Abour reachable
Let be a core point, then every point in its Epsilon neighborhood is said to be directly density-reachable from .
A point is density-reachable from a core point if there is a chain of points .
A point is density-connected to a point if there is a point such that both, and are density-reachable from **.
Clusters in DBSCAN are groups of points that are density-connected, meaning that every point within a cluster must be reachable from any other point in the same cluster through a chain of directly density-reachable points, given a specified epsilon (neighborhood radius, ) and MinPoint (minimum number of points required to form a dense region).
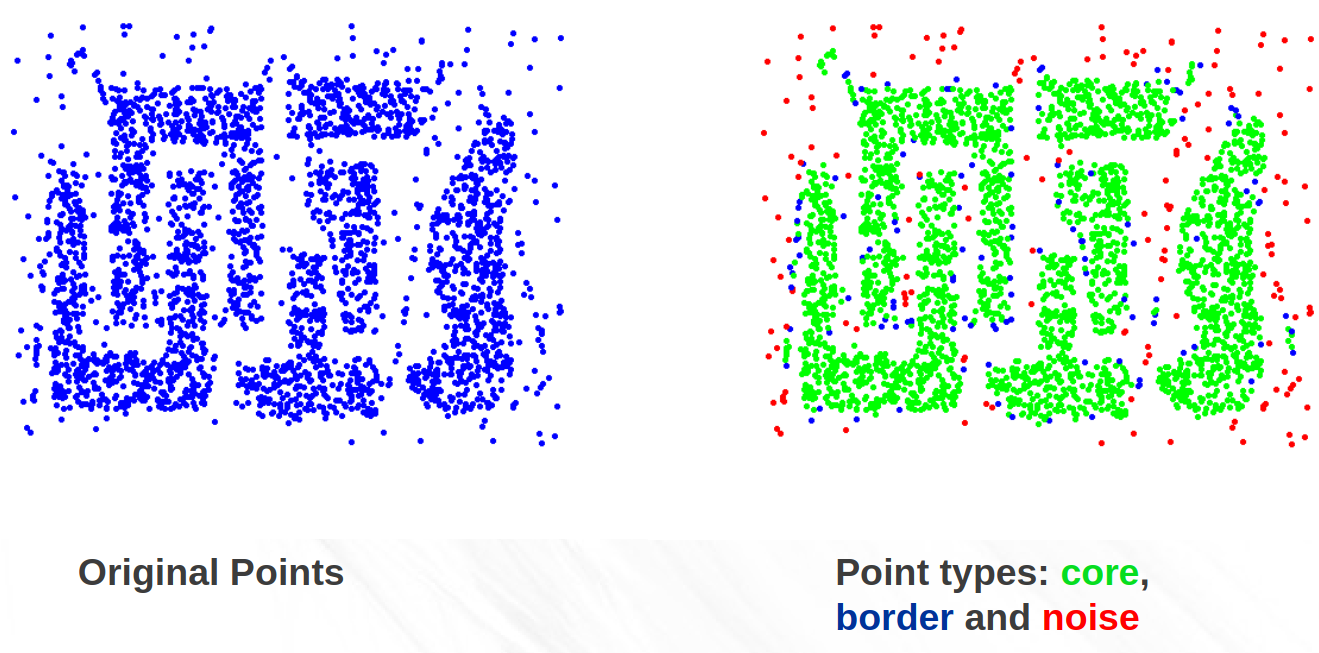
Types of points: The cores, borders, and noises
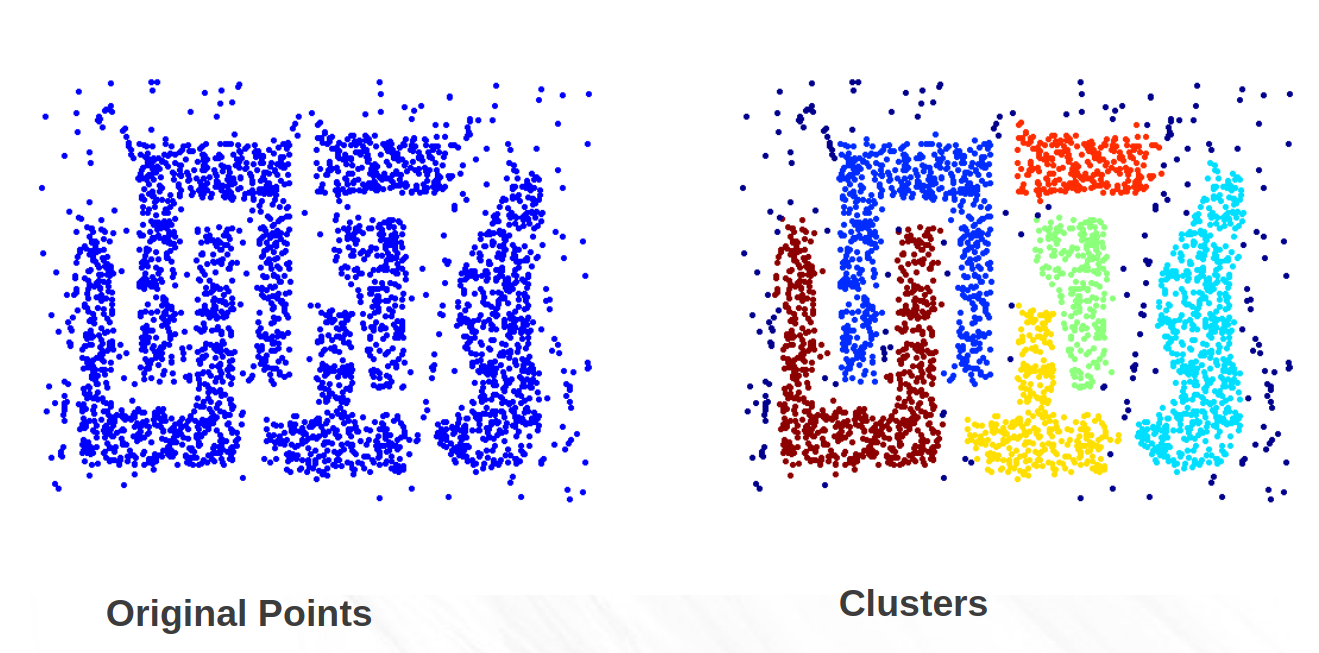
The clusters
Choosing MinPoint
How many nearby points to form a ‘core’?
Domain knowledge: If you have an understanding of how dense the clusters should be, use it to set MinPoint accordingly.
Sensitivity analysis: Experiment with various MinPoint values and evaluate the clustering results based on metrics such as the silhouette score, Calinski-Harabasz index, or your own domain-specific criteria.
Rule of thumb: A common rule of thumb (for starting) is to set MinPoint as twice the number of dimensions in your dataset, especially if you don’t have any domain knowledge about the expected density.
Choosing Epsilon
(search radius)
How close is close?
Domain knowledge: If you have prior knowledge about the scale or density of your data, you can use it to set an appropriate value for ε.
k-distance or k-nearest neighbors: Calculate the k-distance or k-nearest neighbors for various values of k to understand how the local density changes. Choose ε to capture the desired level of density based on these calculations.
Experimentation: Try different values for ε and observe how the clustering results change. Visualizing the clusters can help you assess their quality.
k-distance or k-nearest neighbors
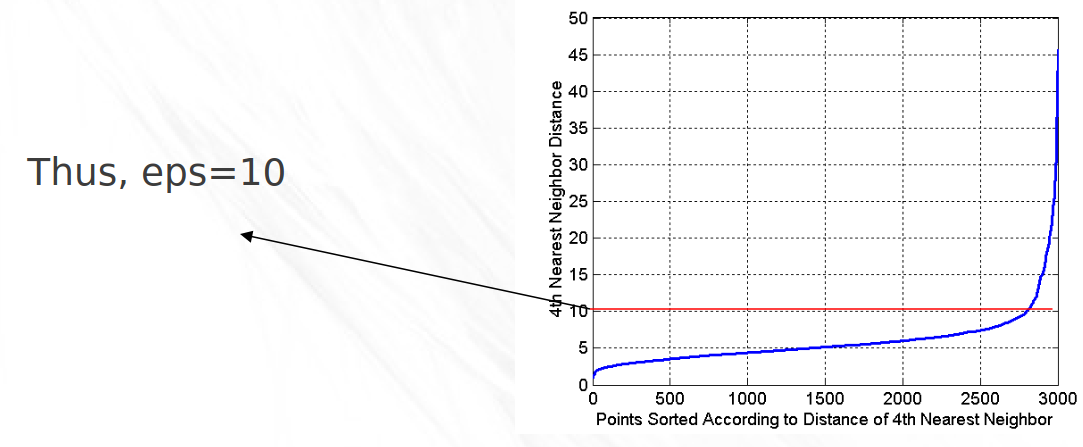
The idea is that for points in a cluster, their th nearest neighbors are at roughly the same distance.
Noise points have the kth nearest neighbor at farther distance.
So, plot sorted distance of every point to its kth nearest neighbor (e.g., ).
Demo using KNN
A real-life application
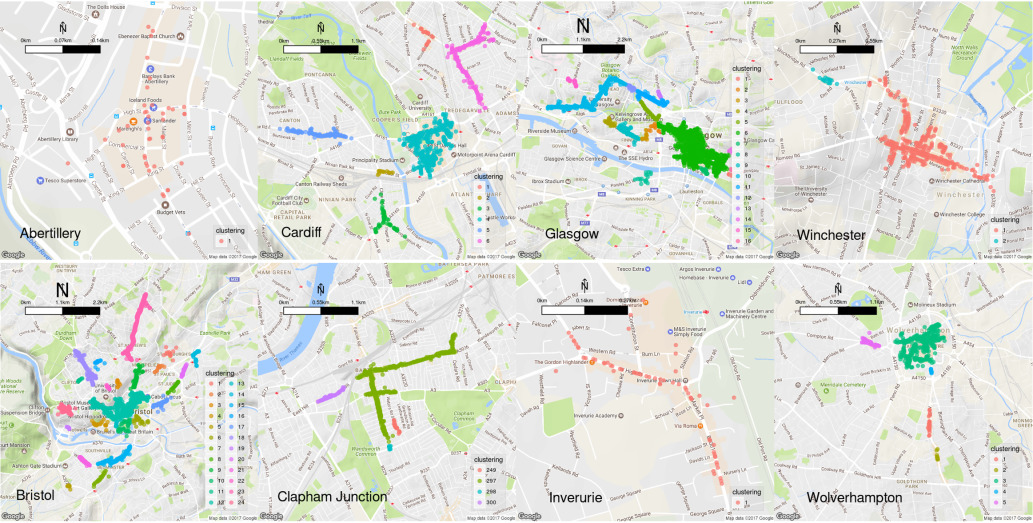
A Modified DBSCAN Clustering Method to Estimate Retail Center Extent. Pavlis et al. 2017
- Pavlis, M., Dolega, L., & Singleton, A. (2017). A Modified DBSCAN Clustering Method to Estimate Retail Center Extent. Geographical Analysis, 50(2), 141–161. 10.1111/gean.12138