What is k-means Clustering?
Definition: k-means is an unsupervised machine learning algorithm used for clustering data points into k distinct, non-overlapping groups based on their similarities and differences.
Objective: The main goal of k-means is to minimize the within-cluster sum of squares (WCSS), which represents the total squared distance (euclidean distance) between data points and their nearest cluster centroid.
Steps & Process
Choose k: Select the number of clusters (k) to generate.
Initialize centroids: Randomly select k initial centroids from the dataset or use other initialization methods like k-means++.
Assign points to clusters: Assign each data point to the cluster with the nearest centroid.
Update centroids: Recalculate the centroid positions by taking the mean of all data points belonging to each cluster.
Repeat: Repeat steps 3 and 4 until convergence, i.e., no further changes in cluster assignments or centroid positions occur.
Steps demo: 1
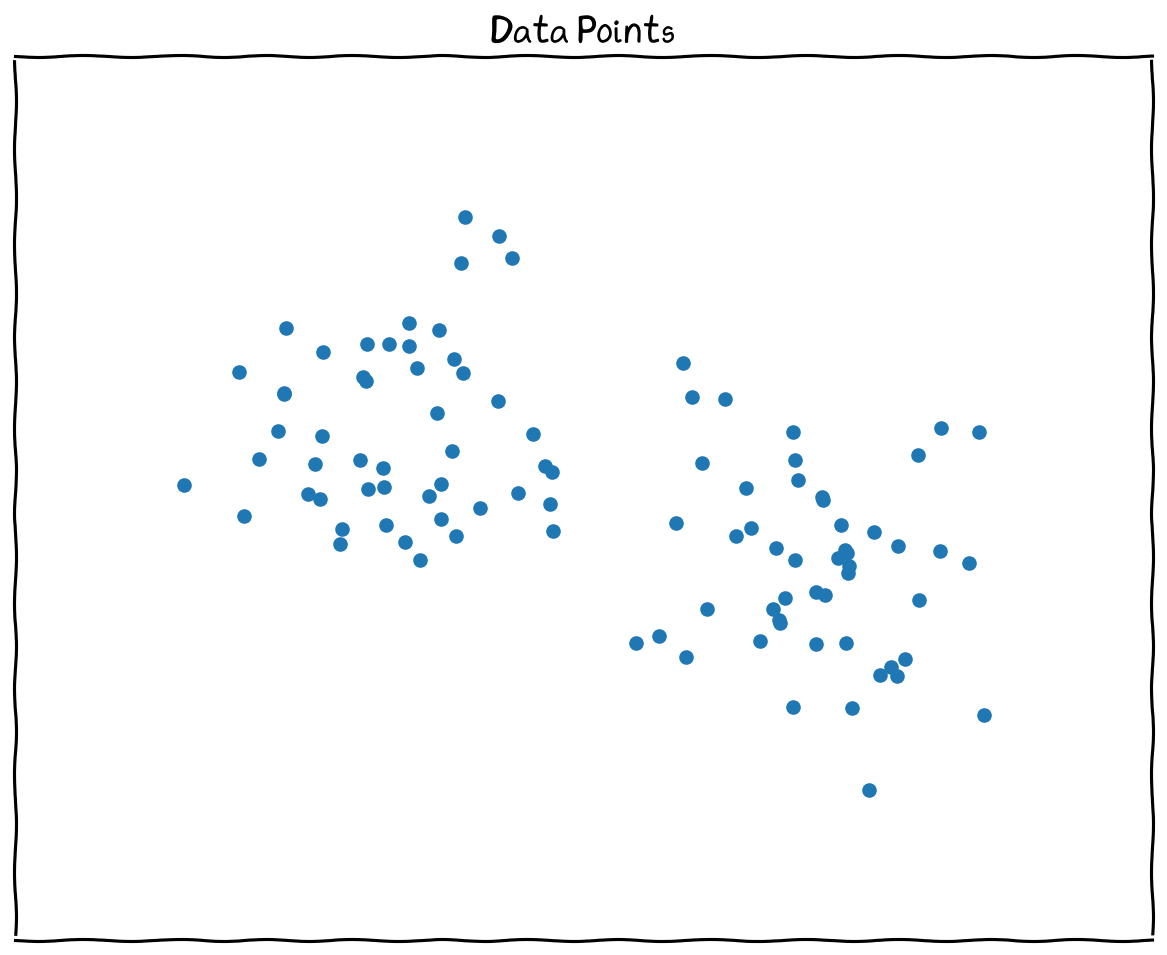
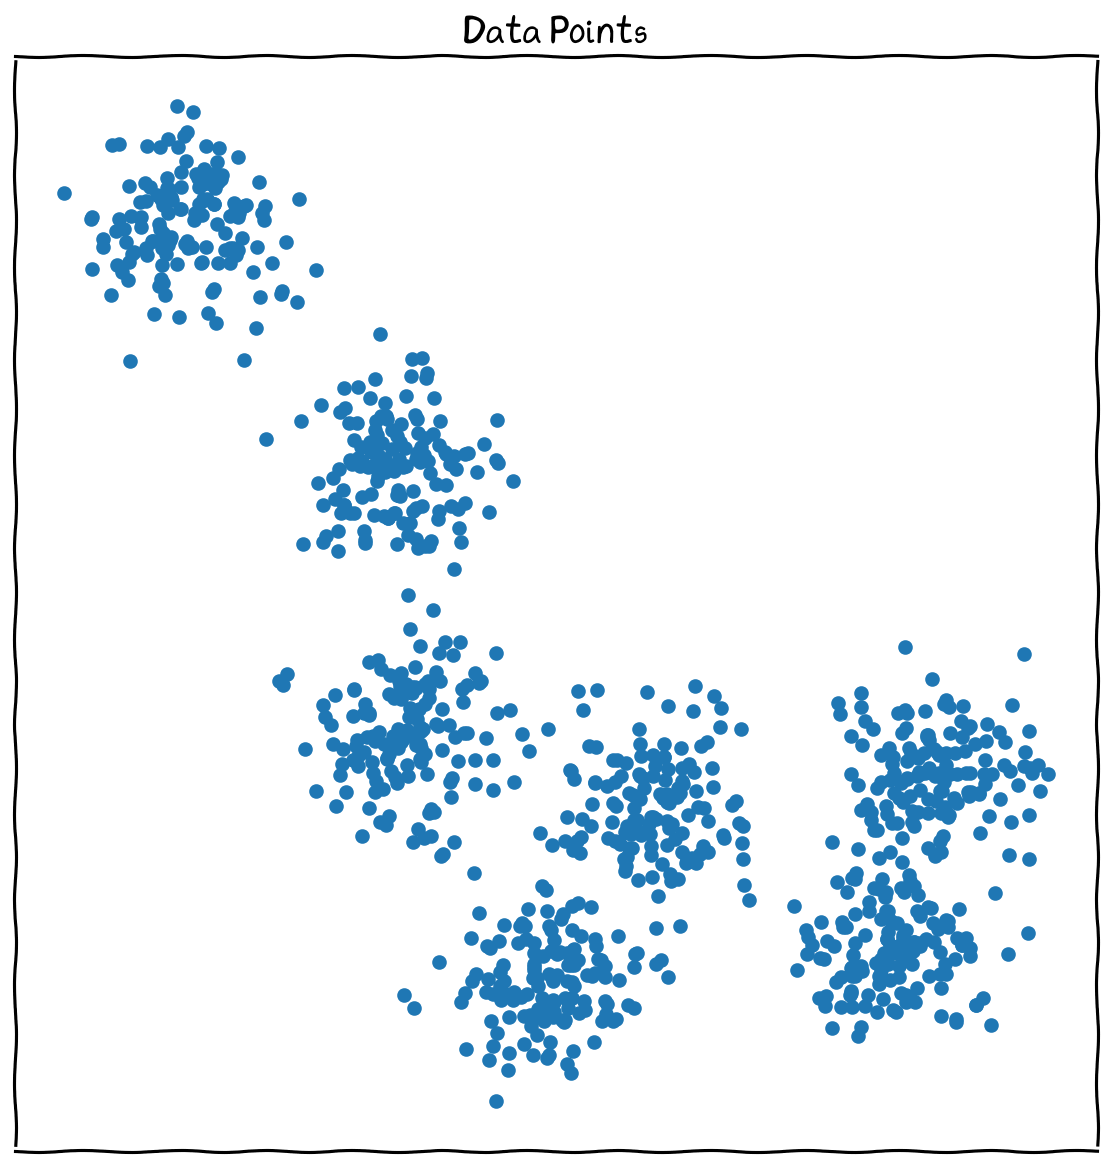
The data point
The steps: 1 Initialize with random centroids. 2 Get the nearest neighbors, and calculate the new mean centers. 3 Move the centers to the mean centers
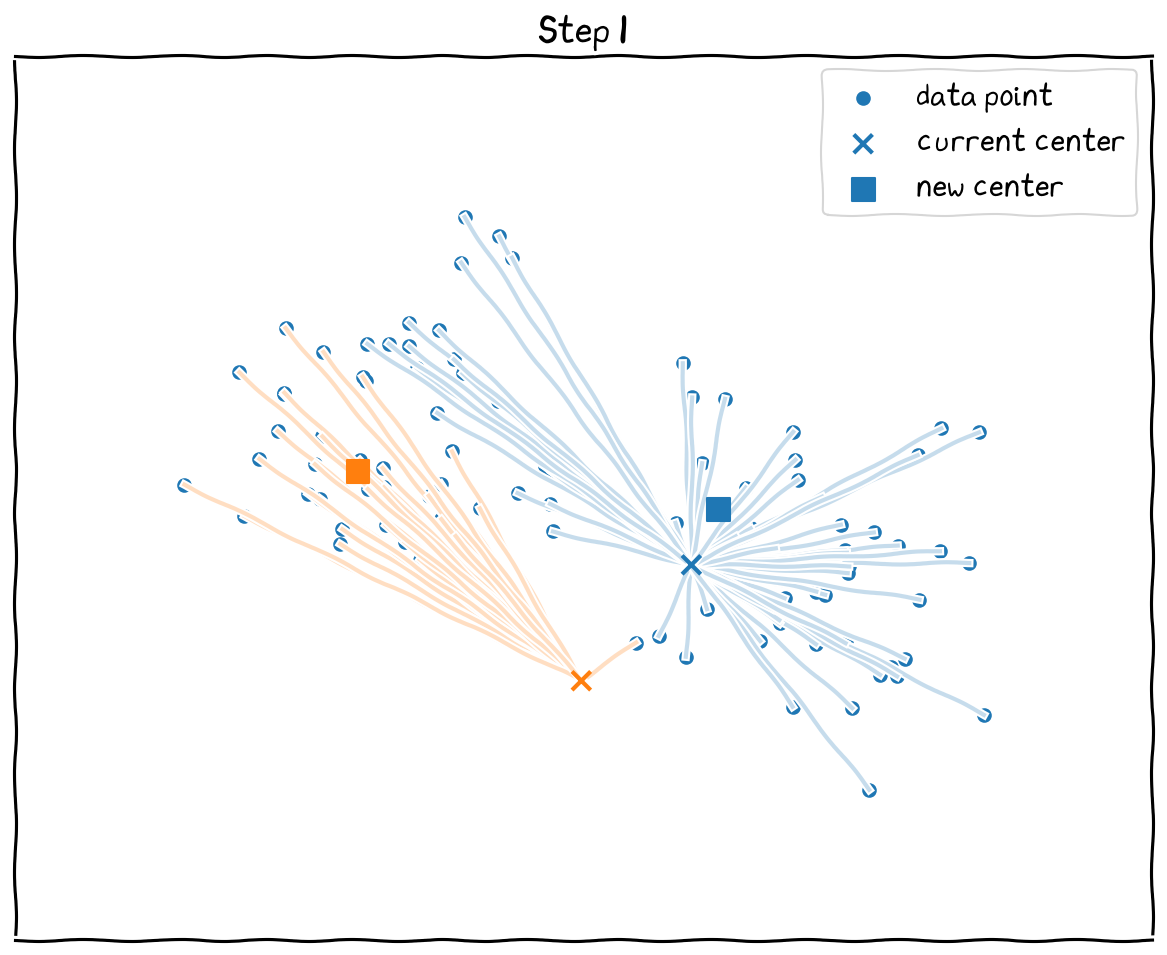
The steps: 1 Re-calculate distance and find nearest neighbors. 2 Re-Calculate new mean centers and move
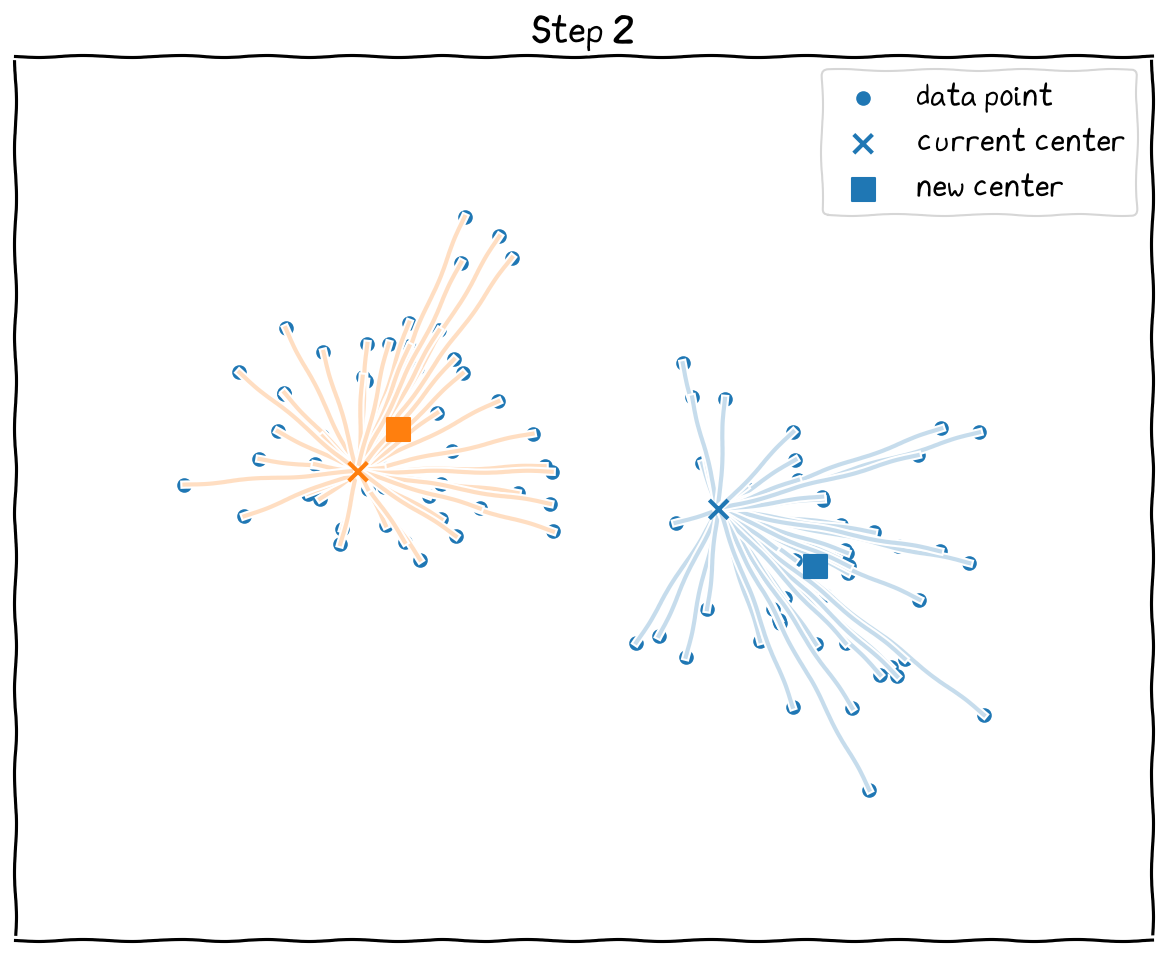
The steps: 1 The location of new and previous centers overlapped. Hence, stops.
k-means Clustering: Example with 7 clusters
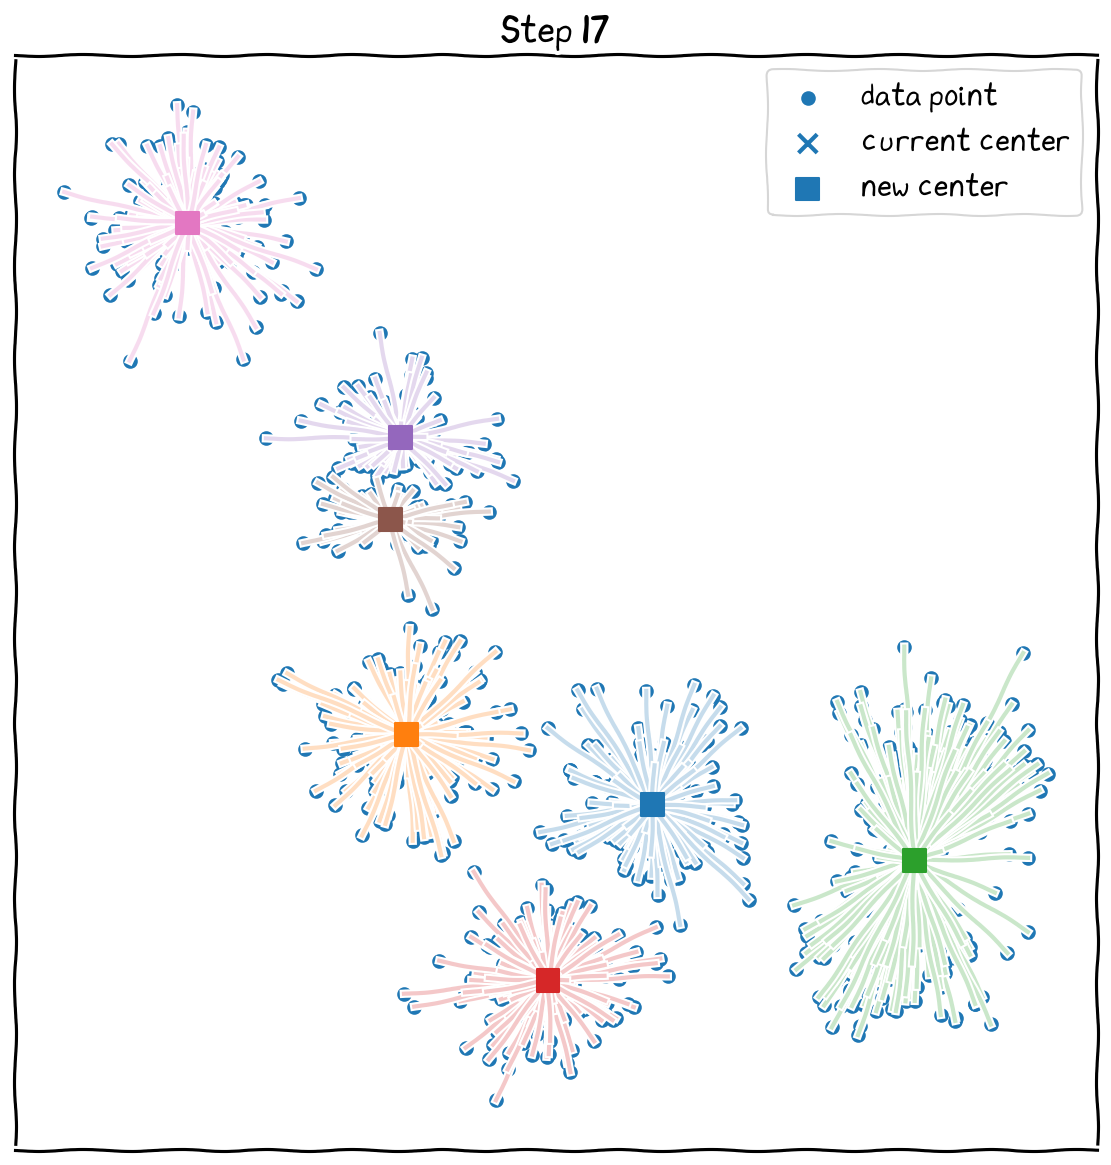
The final clusters.
Parameters and Initialization
How do we know the number of clusters (i.e., the k in k-means)?
How to initialize mean centers’ locations?
How to select k
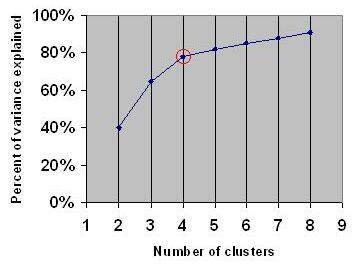
Elbow Method: Plot the explained variation (or distortion) as a function of the number of clusters, and choose the elbow point as the number of clusters to use. The elbow point is the point of diminishing returns, where the additional gain in reducing the distortion starts to decrease significantly as more clusters are added. For the final iteration (i), the explained variation (EV^i) can be calculated by the distance between each point (k) and the cluster they were assigned (C_j^i).
where
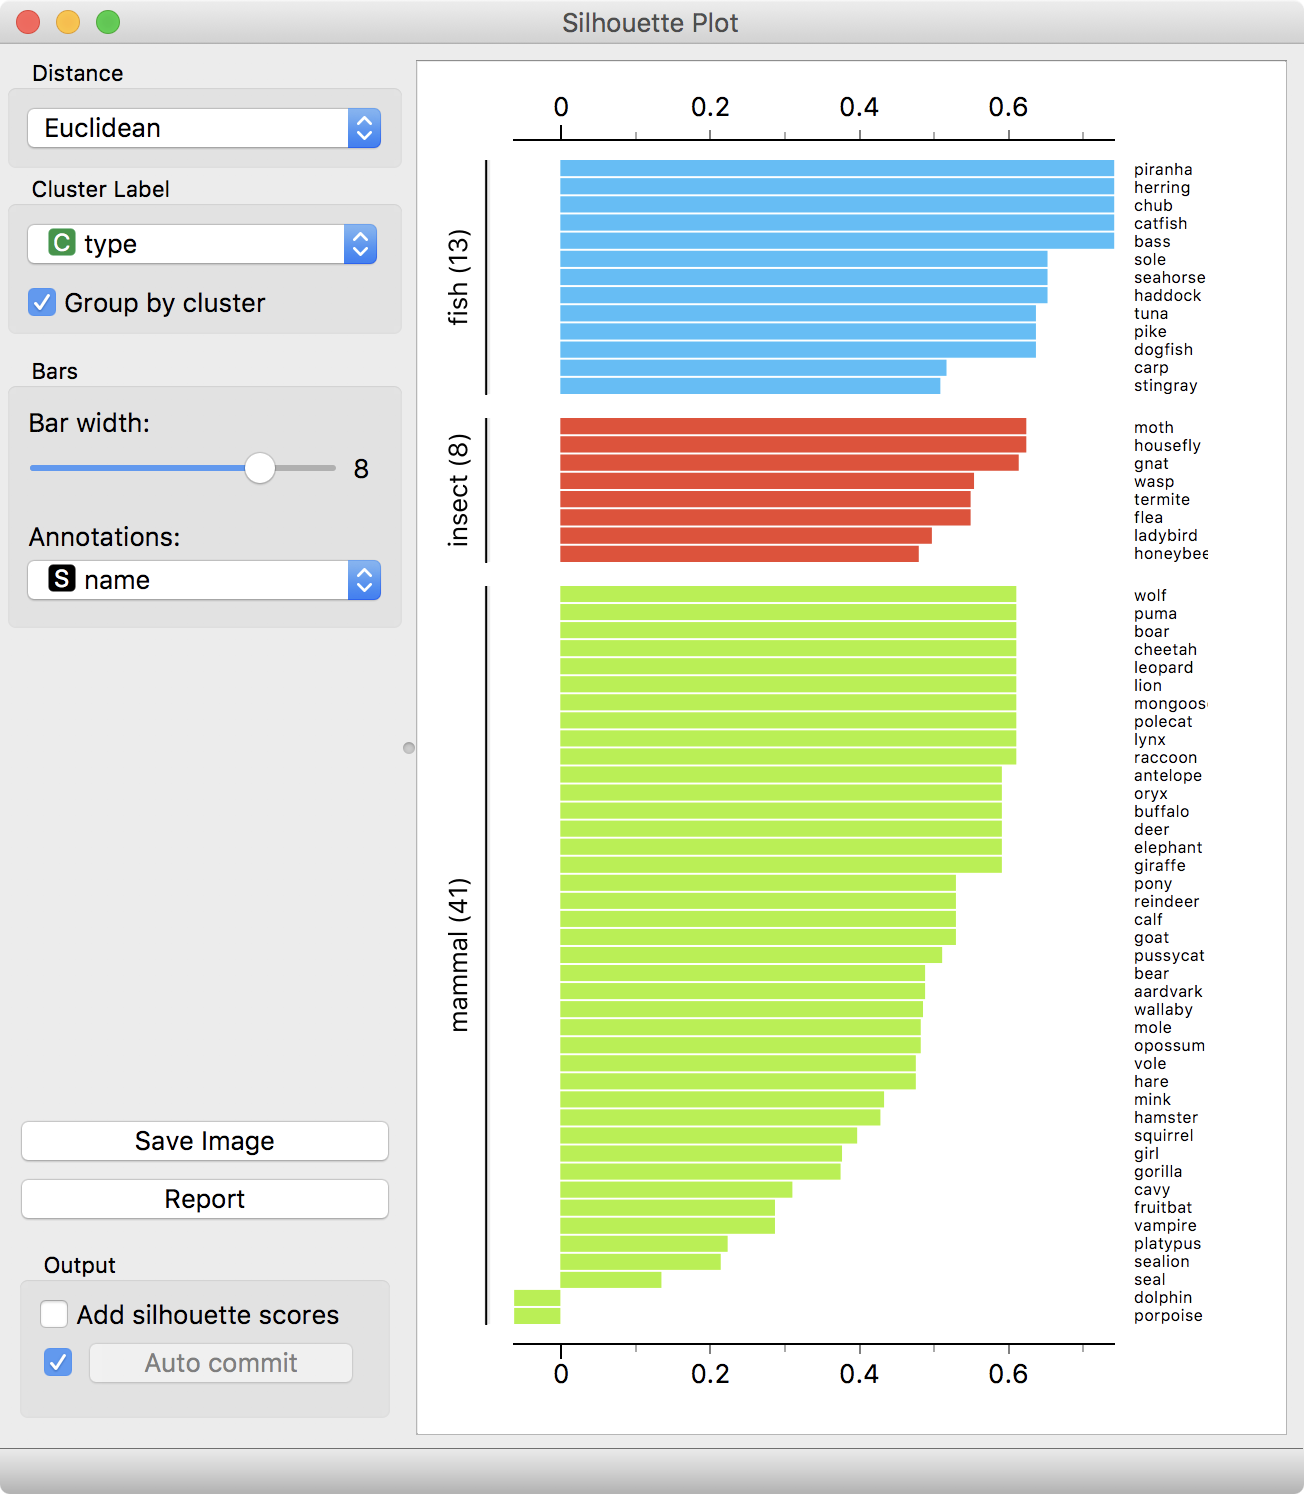
Silhouette Analysis: Calculate the average silhouette score () for different values of k and choose the value that yields the highest score. The silhouette score measures the cohesiveness of datapoints within a cluster compared to their closeness to datapoints in other clusters, with values closer to 1 indicating well-defined clusters.
is the average distance between point i and all other points in its own cluster:
where,
is the lowest average distance between point i and all points in any other cluster:
where, and
Note that the Silhouette Coefficient ranges between -1 and 1, with higher values indicating better clustering.
Other approaches
Gap Statistic: Compare the total within-cluster variation for different values of k and choose the value that maximizes the gap statistic, which is the difference between the observed and expected within-cluster variation.
Domain Knowledge: Rely on your knowledge of the dataset and the problem domain to choose a value for k that makes sense in the context of your analysis.
How set the initial position of the mean centers?
Random Initialization: Randomly select k points from the dataset to serve as the initial centers. This method is simple but may lead to suboptimal clusters due to its unpredictability.
k-means++: Choose the first center randomly from the dataset. Then, for each subsequent center, choose a point from the dataset with a probability proportional to its squared distance from the nearest existing center. This method tends to provide better clustering results than random initialization.
Furthest Point: Calculate the distances between all pairs of points in the dataset, then choose the two points with the largest distance as the first two centers. For each subsequent center, select the point that maximizes the minimum distance to the previously chosen centers.
Properties of k-means clustering
Guaranteed to converge in a finite number of iterations.
Running time per iteration:
assign data points to closest cluster center: O(KN) time
change the cluster center to average of its assigned points: O(N)
Sensitive to outliers since an object with an extremely large value may substantially move a center.