The Data-Driven World
In today’s world,
data is everywhere and anytime
everyone is using data
make informed decisions
drive innovation
improve outcomes
the true value of data lies not only in its collection and analysis but also in its effective communication
This is where data storytelling plays a crucial role.
Data Storytelling?
Definition
Data storytelling is the process of transforming complex data into engaging and easy-to-understand narratives, allowing audiences to quickly grasp insights and take action.
Data storytelling combines data, visuals, narrative and interactivity to create compelling stories that resonate with people, regardless of their background or expertise.
Benefits
Data storytelling can help:
Improved Decision-Making: Data storytelling enables decision-makers to comprehend complex information quickly, leading to more informed choices and better outcomes.
Wider Audience Reach: By making data more accessible and engaging, data storytelling helps reach a broader audience, fostering collaboration and driving change.
Greater Engagement: Stories tap into human emotions and experiences, making data more relatable and memorable. This increased engagement leads to better retention and understanding of key insights.
Increased Trust and Credibility: Clear and transparent data storytelling builds trust and credibility, helping stakeholders feel confident in the validity of the insights presented.
Problem-Solving and Innovation: By revealing hidden patterns and relationships, data storytelling fosters problem-solving, innovation, and the development of new strategies.
Geospatial Data Storytelling
Definition
Geospatial data storytelling is the art of combining geographic data, visualizations, and compelling narratives to communicate insights and patterns within a spatial context. It involves the use of maps, spatial relationships, and location-based data to create engaging and informative stories that help audiences understand complex geographic phenomena and make informed decisions.
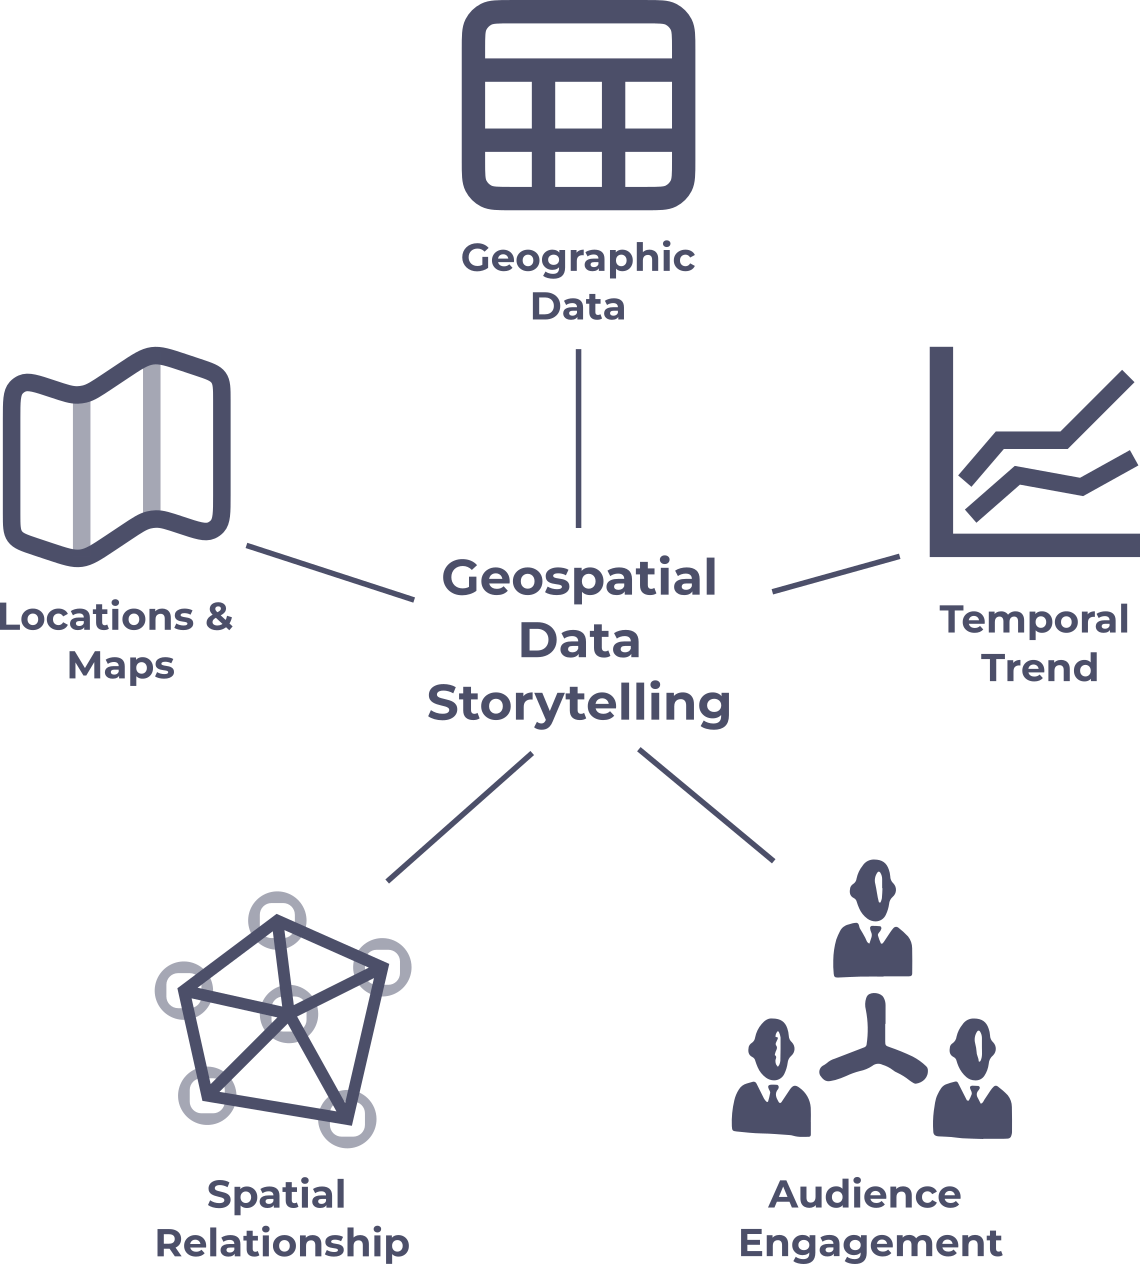
Geospatial Data Storytelling
Key characteristics
Geographic Data: Geospatial data storytelling relies on geographic data, which includes any information associated with a specific location. This data can be either vector (e.g., points, lines, and polygons) or raster (e.g., aerial imagery and satellite data) and often includes attributes that describe the features’ characteristics.
Locations & Maps: Maps are a central component of geospatial data storytelling, serving as the canvas on which data is visualized and stories are told. They provide a spatial context for the narrative, helping audiences understand the relative location, distribution, and relationships between various geographic features.
Spatial Relationships: A key aspect of geospatial data storytelling is the focus on spatial relationships, such as proximity, connectivity, and overlap between geographic features. These relationships can reveal patterns and trends that would otherwise be difficult to identify, enabling more informed decision-making.
Temporal Trends: In addition to spatial relationships, geospatial data storytelling often incorporates temporal analysis, exploring how geographic patterns and relationships change over time. This can provide valuable insights into past trends and help predict future outcomes.
Audience Engagement: Geospatial data storytelling can incorporate multimedia elements like images, videos, and interactive features to create a more engaging and immersive experience for the audience. Interactive maps and visualizations encourage exploration and enable users to discover insights tailored to their interests.
Key Elements of a Successful Data Story
A successful data story engages the audience, effectively communicates insights, and drives action. A successful data story combines these elements to create a compelling narrative that informs, engages, and drives change. By focusing on the audience, using strong visuals, and providing clear insights, data storytellers can maximize the impact of their work.
Clear Objective A well-defined objective ensures that the data story stays focused and addresses the intended goals. The objective should be aligned with the audience’s interests and needs.
Targeted Audience Tailor the data story to the audience’s level of expertise, interests, and expectations. Consider their needs and the actions you want them to take after engaging with the story.
Strong Narrative A strong narrative weaves together data, visuals, and text to create a cohesive and engaging story. Utilize storytelling techniques like conflict, resolution, and character development to make the narrative more compelling.
Informative and Relevant Data Select data that is accurate, relevant, and supportive of the narrative. Ensure that the data insights are clearly communicated through appropriate visualizations and context.
Effective Visualizations Choose the most suitable visualizations to represent the data, and ensure they are easy to understand, visually appealing, and consistent in design.
Context and Perspective Provide context for the data, explaining its relevance, source, and limitations. Incorporate diverse perspectives to create a balanced and comprehensive narrative.
Interactivity and Exploration Enable the audience to interact with the data and explore it on their terms, enhancing engagement and understanding.
Clear and Actionable Insights: Present insights that are easy to grasp and provide clear recommendations for action or further investigation.
Concluding Remarks and Next Steps Wrap up the data story with a summary of key points, implications, and suggested next steps. This helps reinforce the main message and encourages the audience to take action.
Knowing Your Audience
Understanding the audience and their needs is crucial in data storytelling, as it enables the creation of impactful and engaging narratives that resonate with the intended recipients. Understanding your audience and their needs is a fundamental aspect of effective data storytelling. By tailoring content, addressing specific interests, and presenting insights in a relatable manner, you can create powerful narratives that resonate with the audience and inspire action.
Tailored Content By understanding the audience’s interests, background, and expectations, you can select and prioritize data insights that are most relevant to them. Tailoring the content to their needs increases engagement and ensures the message is more likely to be heard and acted upon.
Appropriate Complexity Knowing your audience’s level of expertise allows you to present data and insights with the appropriate level of complexity. This ensures that the audience can understand and engage with the content without feeling overwhelmed or bored.
Effective Communication Adjusting the tone, language, and structure of your data story to suit the audience’s preferences improves communication and comprehension. This helps establish a connection with the audience and makes the narrative more relatable and engaging.
Addressing Pain Points and Objectives By understanding the challenges and goals of your audience, you can frame the data story in a way that demonstrates how the insights can address their specific needs or objectives. This increases the likelihood that the audience will find the story valuable and act on the information provided.
Building Trust and Credibility Tailoring the data story to the audience’s needs and preferences shows that you understand and care about their interests. This helps build trust and establishes your credibility as a reliable source of information.
Encouraging Action Knowing your audience’s motivations and barriers to action allows you to create a data story that encourages them to take the desired next steps. By addressing potential objections or concerns, you increase the chances of your story driving meaningful change.
Key Components of a Compelling Data Story

Key Components of a Compelling Data Story
A successful data story engages the audience, communicates insights effectively, and inspires action. Here are the essential elements that contribute to a powerful data story:
Clear Structure A well-structured data story has a logical flow, guiding the audience through the narrative. It typically includes an introduction, rising action, climax, and resolution, mirroring the elements of traditional storytelling.
Compelling Characters Characters in a data story can be individuals, groups, or entities that are central to the narrative. By showcasing their experiences, challenges, and transformations, you create a relatable and engaging story that humanizes the data.
Conflict A compelling data story presents a problem or challenge that needs to be addressed. This conflict generates tension and curiosity, encouraging the audience to continue exploring the narrative to discover potential solutions or insights.
Key Components of a Compelling Data Story
A successful data story engages the audience, communicates insights effectively, and inspires action. Here are the essential elements that contribute to a powerful data story:
Resolution (as in for resolving the conflict) The resolution reveals how the conflict is addressed or resolved, providing a sense of closure and satisfaction for the audience. This element should highlight the key insights and takeaways from the data story.
Strong Theme A strong theme ties together the various elements of the data story and communicates the overarching message or lesson. The theme should be relevant to the audience and provide a clear takeaway that encourages reflection or action.
Interactivity and Engagement In the context of data storytelling, incorporating interactive elements and fostering engagement can elevate the overall impact of the story.
Best Practices & Considerations
Appropriate Visualization Methods
Clear and Consistent Symbolization
Avoid Clutter and Complexity
Provide Context
Visual Design Elements
Interactivity
Clear Labeling and Legends
User Experience
Accompany Visualizations with Narrative
Be Transparent
Choose Appropriate Visualization Methods Select visualization methods that align with the nature of the data and the story you want to tell. Common geospatial visualizations include choropleth maps, heatmaps, dot density maps, and cartograms.
Use Clear and Consistent Symbolization Use colors, symbols, and patterns that effectively communicate the data without causing confusion. Stick to consistent symbolization throughout the visualization.
Avoid Clutter and Complexity Keep the visualization clean and uncluttered by avoiding unnecessary labels, icons, or details. Break down complex data into smaller, more manageable visualizations if needed.
Provide Context Include relevant contextual information such as scale, orientation, and neighboring geographic features to help the audience understand the spatial relationships and context.
Visual Design Elements Choose color palettes that are visually appealing, accessible, and effectively communicate the data. Other design elements such as size, shapes, weights, styles should also be carefully considered.
Incorporate Interactivity Utilize interactive elements (e.g., hover-over tooltips, zoom functions, or layer toggles) to enhance the audience’s exploration and understanding of the visualization.
Provide Clear Labeling and Legends Ensure that all visualizations have clear titles, labels, and legends to help the audience interpret the data and understand the visualization’s purpose.
Consider User/Reader Experience: Design the visualization with the user/reader in mind, ensuring it is easy to navigate, understand, and interact with. Test the visualization with users to gather feedback and improve the design.
Accompany Visualizations with Narrative Use narrative elements to provide context, highlight key insights, and guide the audience through the data story.
Be Transparent About Data Sources and Limitations Clearly communicate the data source, accuracy, and any limitations to maintain transparency and credibility.