What is statistics?
From data to information.
The two main types of statistics:
Descriptive Statistics is about how we describe data. This branch focuses on summarizing and describing the main features of data, such as mean, median, standard deviation, and correlation. Descriptive statistics helps visualize and interpret data through graphical methods like histograms, scatter plots, box plots, and maps.
Inferential Statistics is about what we can learn from the data. This branch involves drawing conclusions about a population based on a sample by using probability theory. Inferential statistics allows us to make predictions, test hypotheses, and evaluate the reliability of conclusions. Some common methods in inferential statistics include regression analysis, hypothesis testing, and confidence intervals.
Descriptive Statistics
The three types of measures in descriptive statistics
Measures of Central Tendency: These measures provide an indication of the “center” or “middle” of a dataset. They include: mean, median, mode.
Measures of Spread (Variability): These measures describe how spread out or dispersed the data is. They include: range, variance, standard deviation.
Measures of Shape: These measures help characterize the shape or distribution of the data, including: skewness, kurtosis.
Measures of Central Tendency
help us understand the central or ‘average’ values in a dataset.
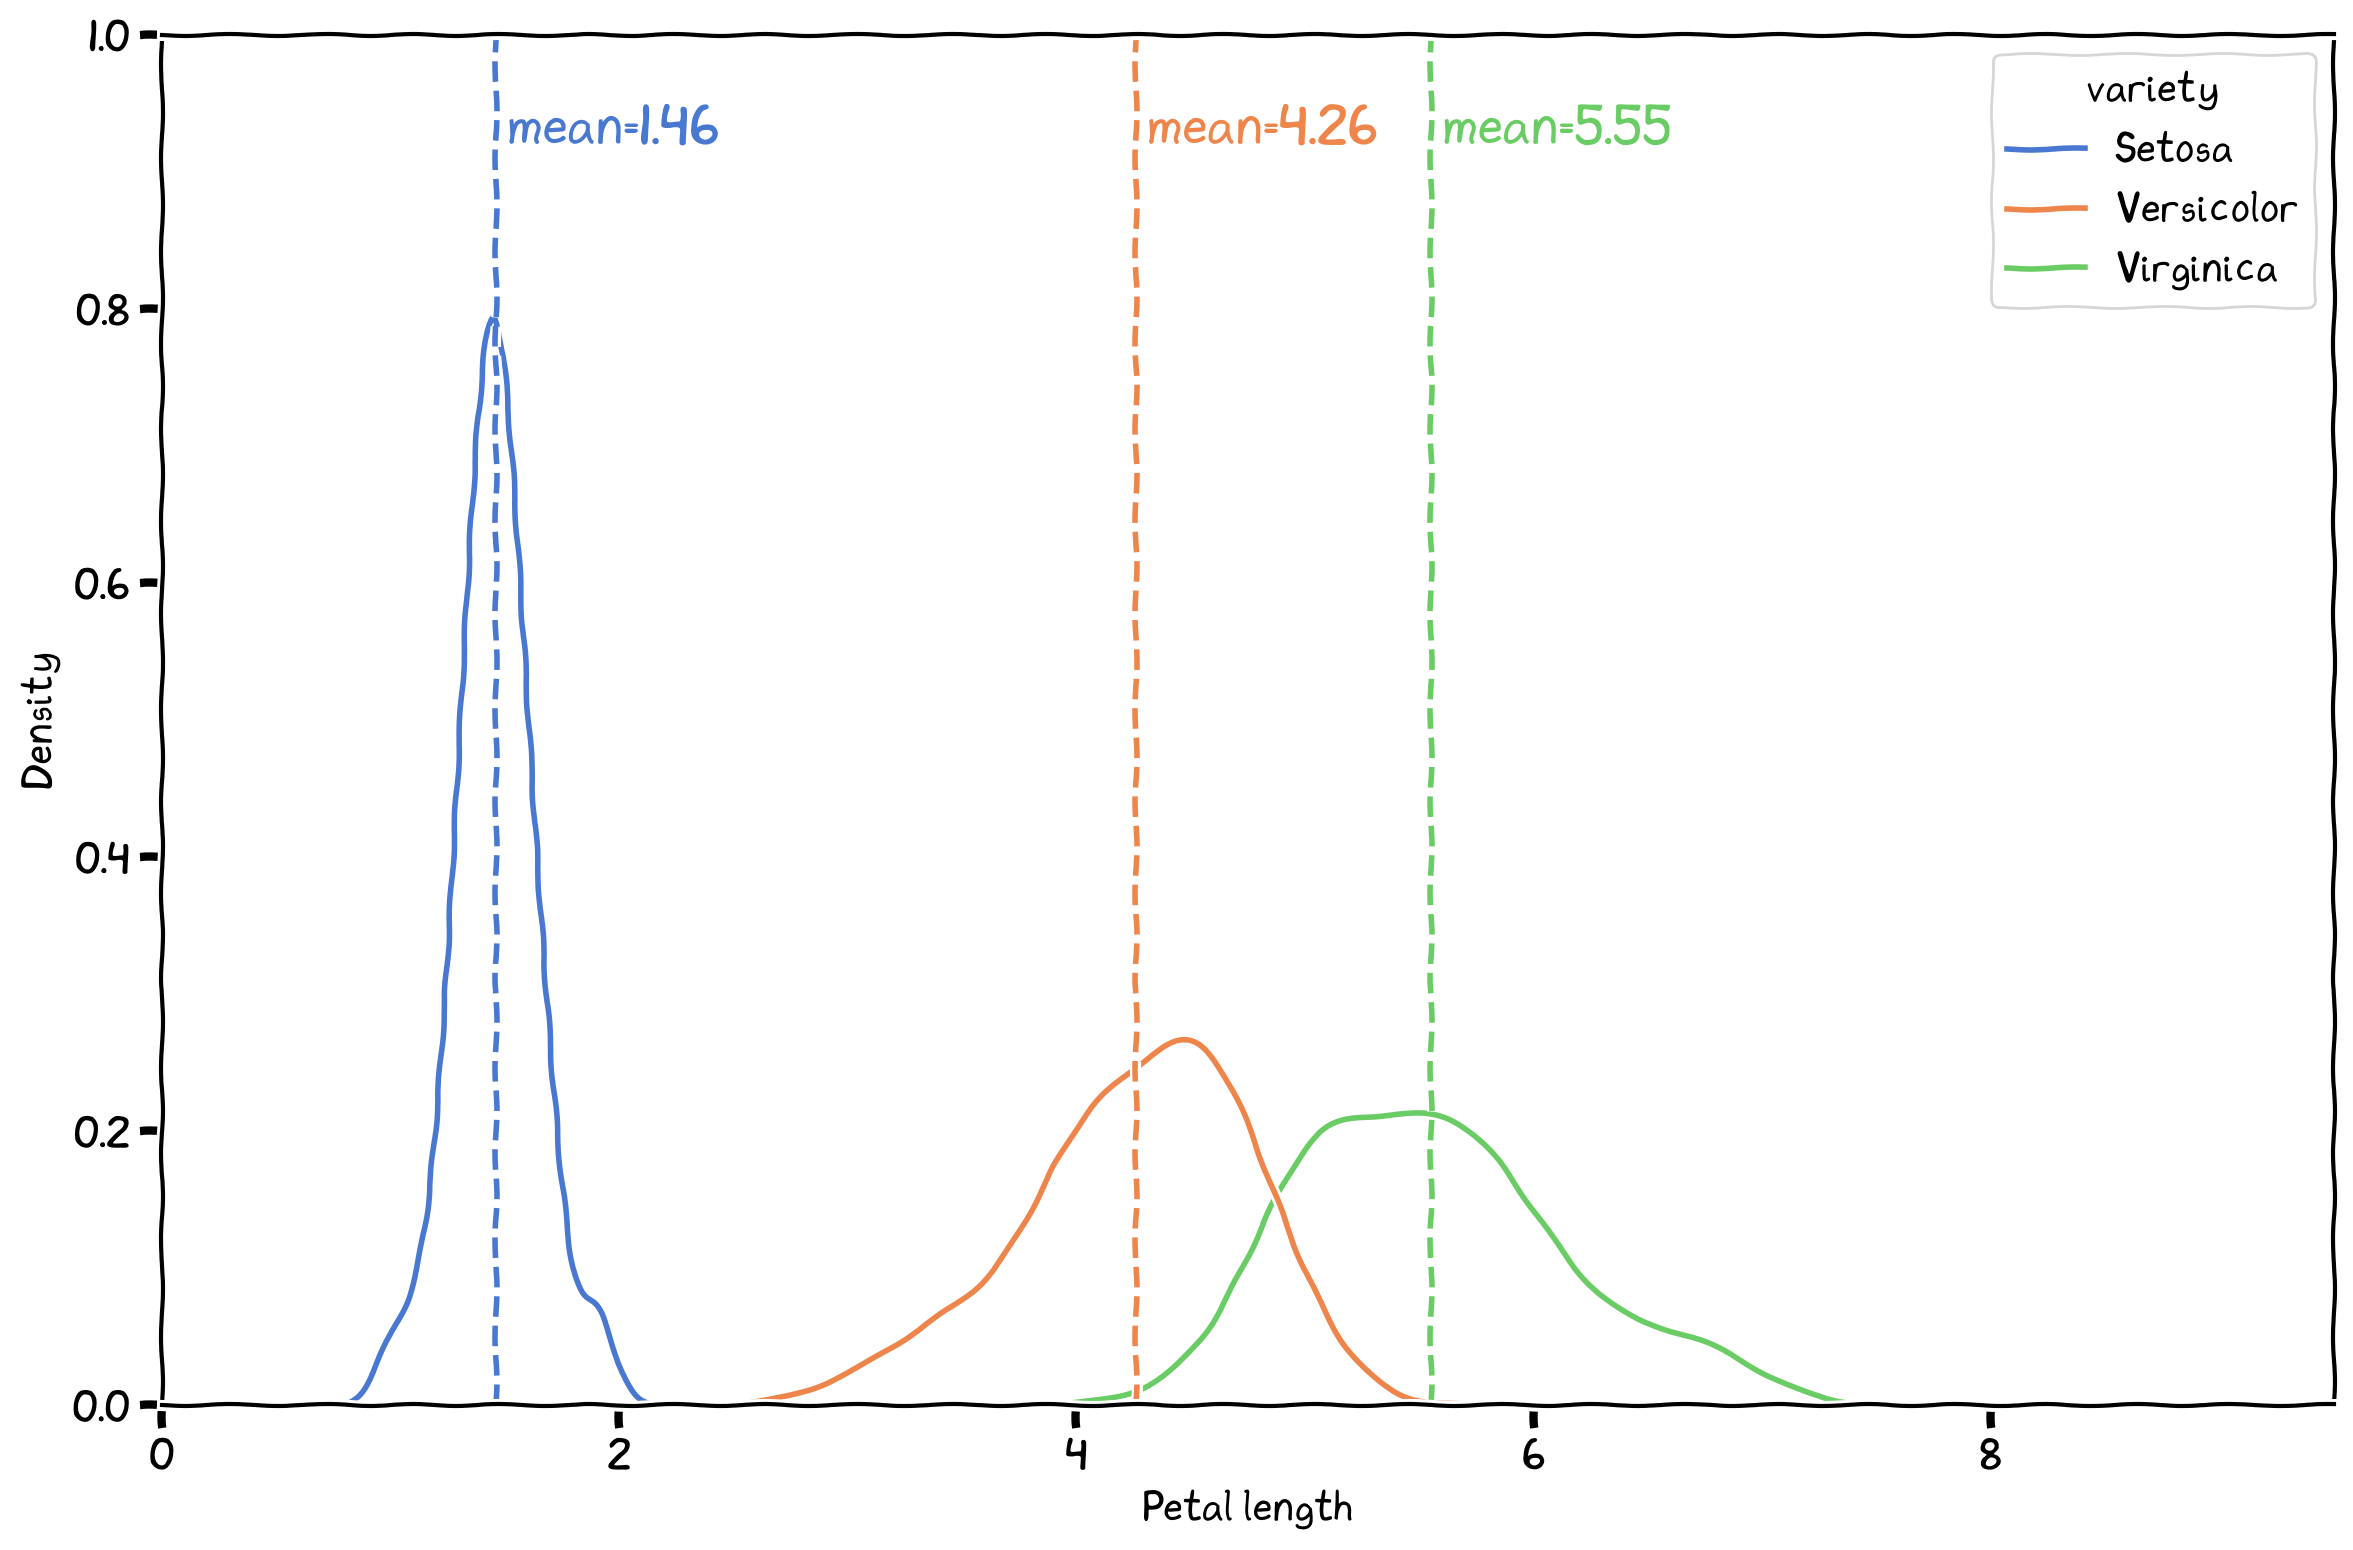
Figure 1:The means of the three IRIS species.
Measures of Spread
(variability) describe how the data is spread or dispersed around the central values.
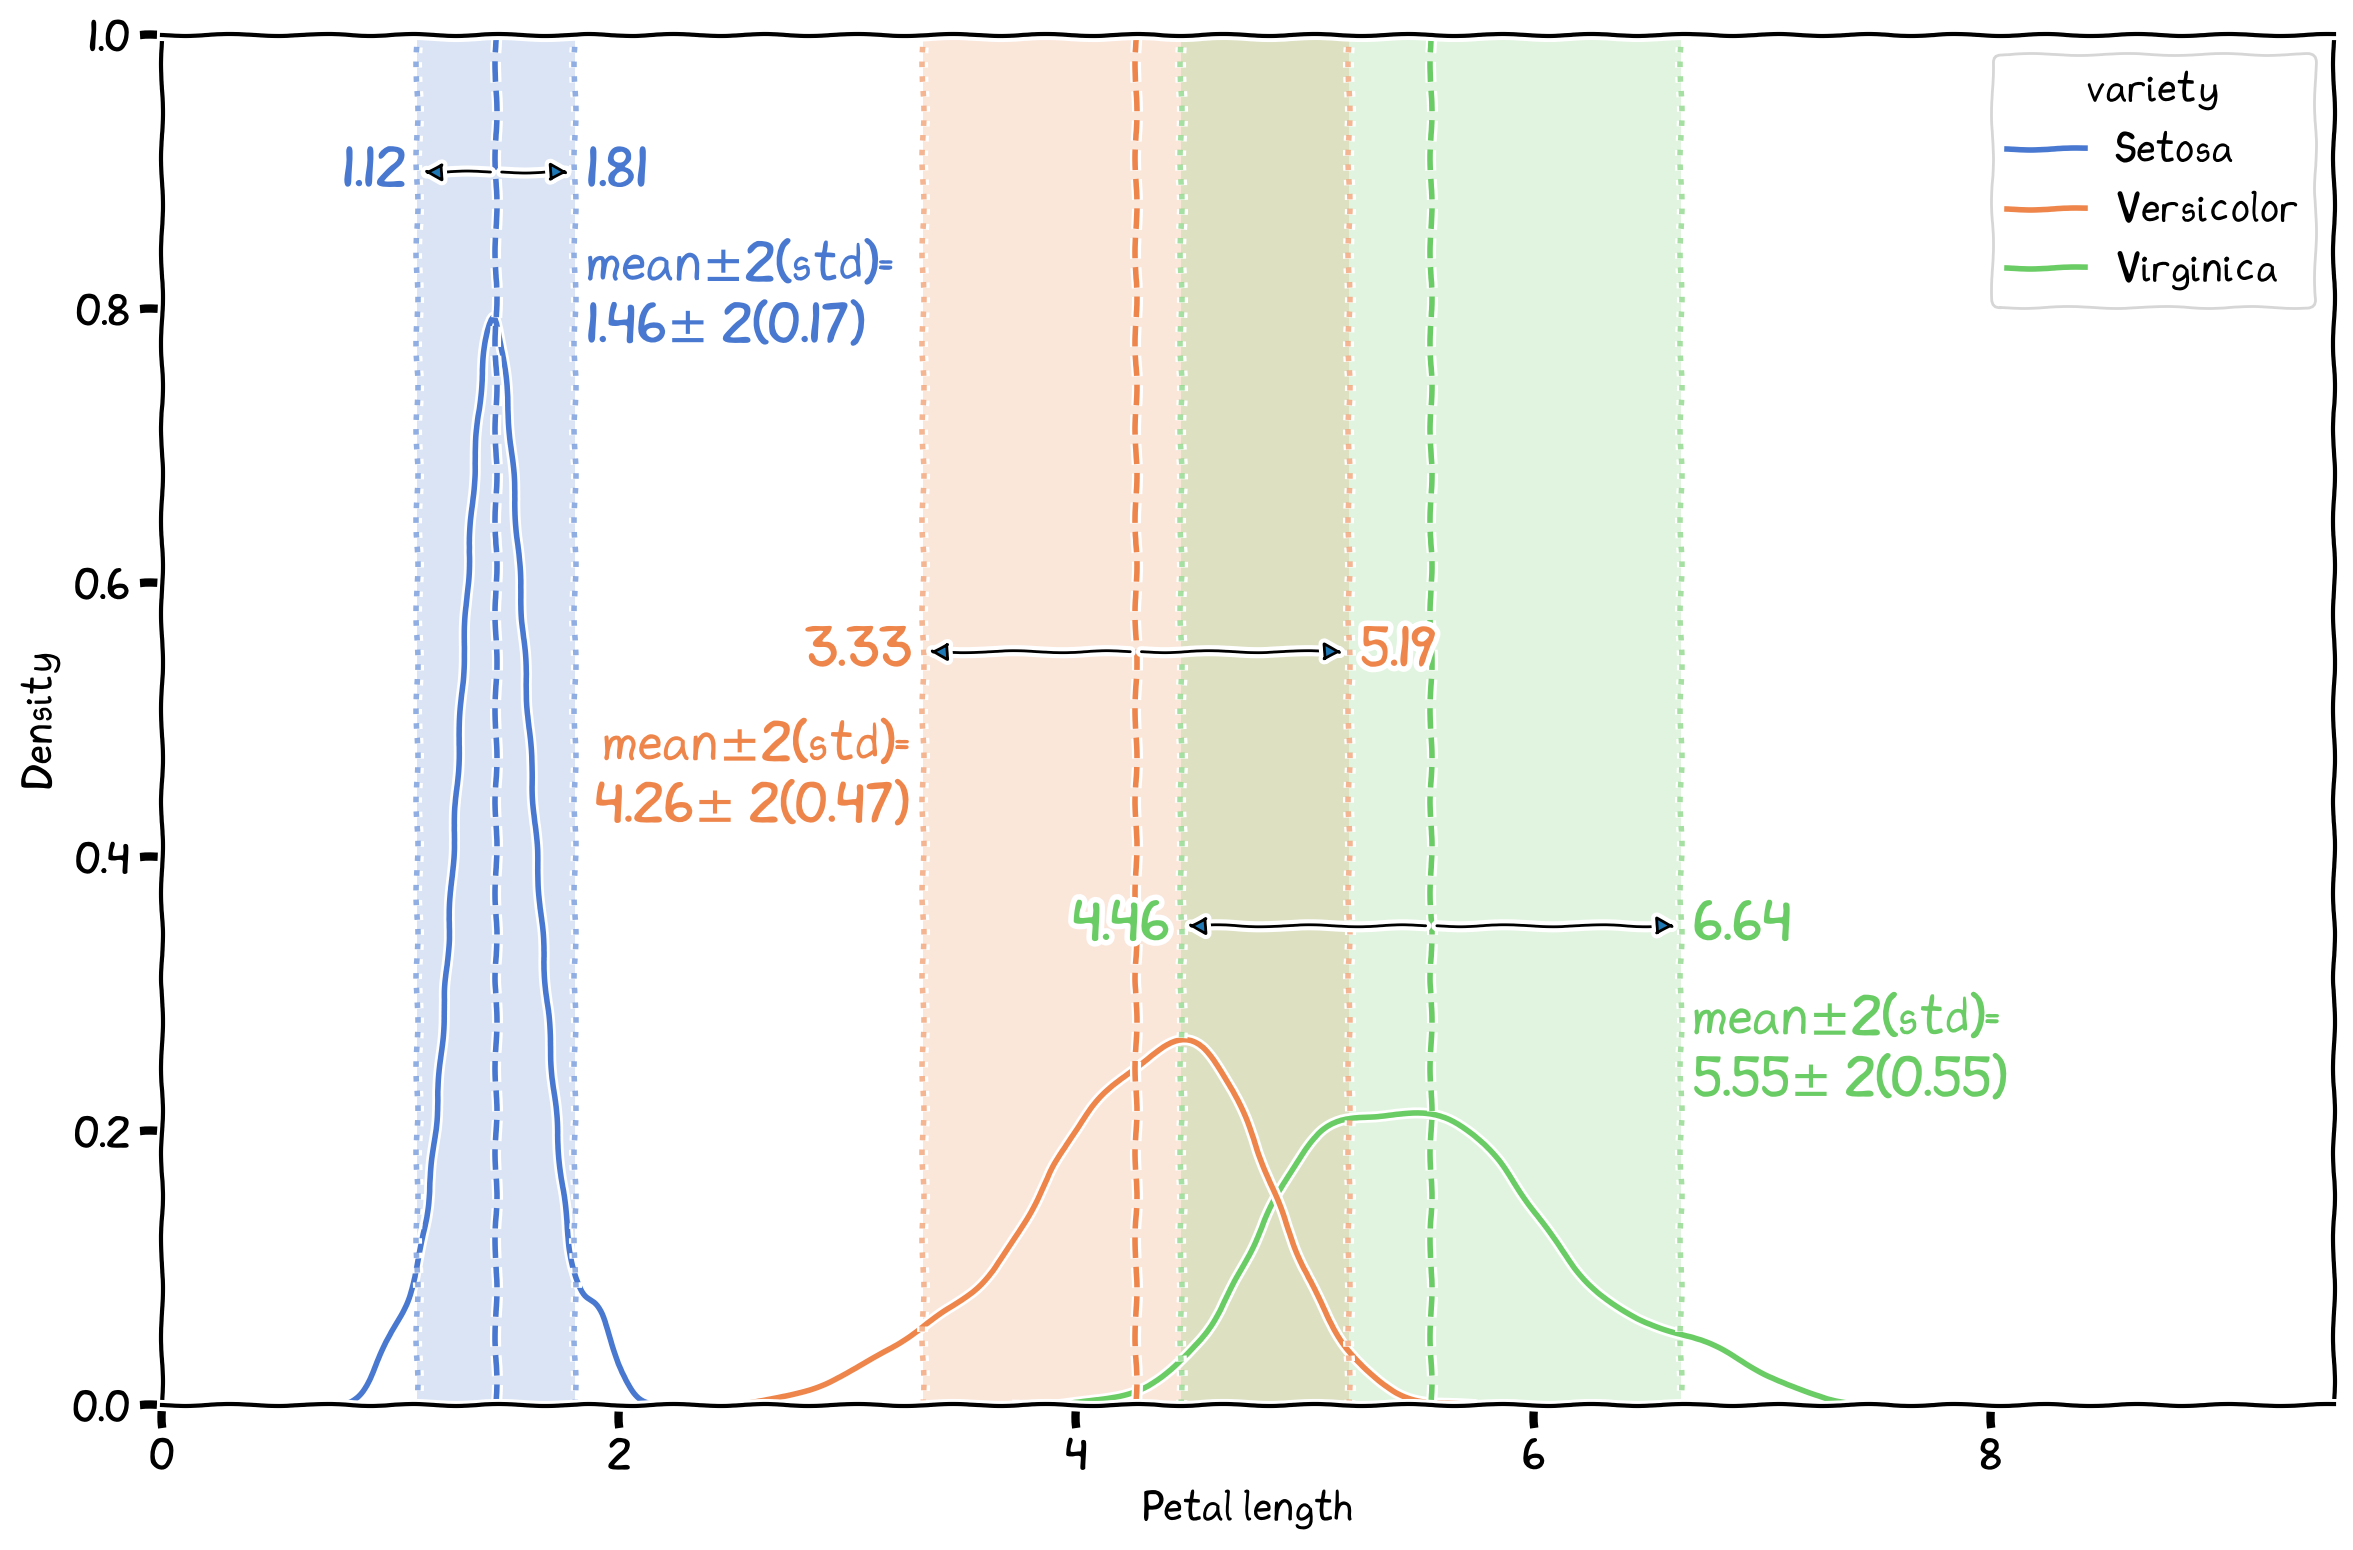
Figure 2:The spread of the three IRIS species.
Measures of Shape
describe the shape of the distribution, which could be steep/flat, skewed, or non-normal.
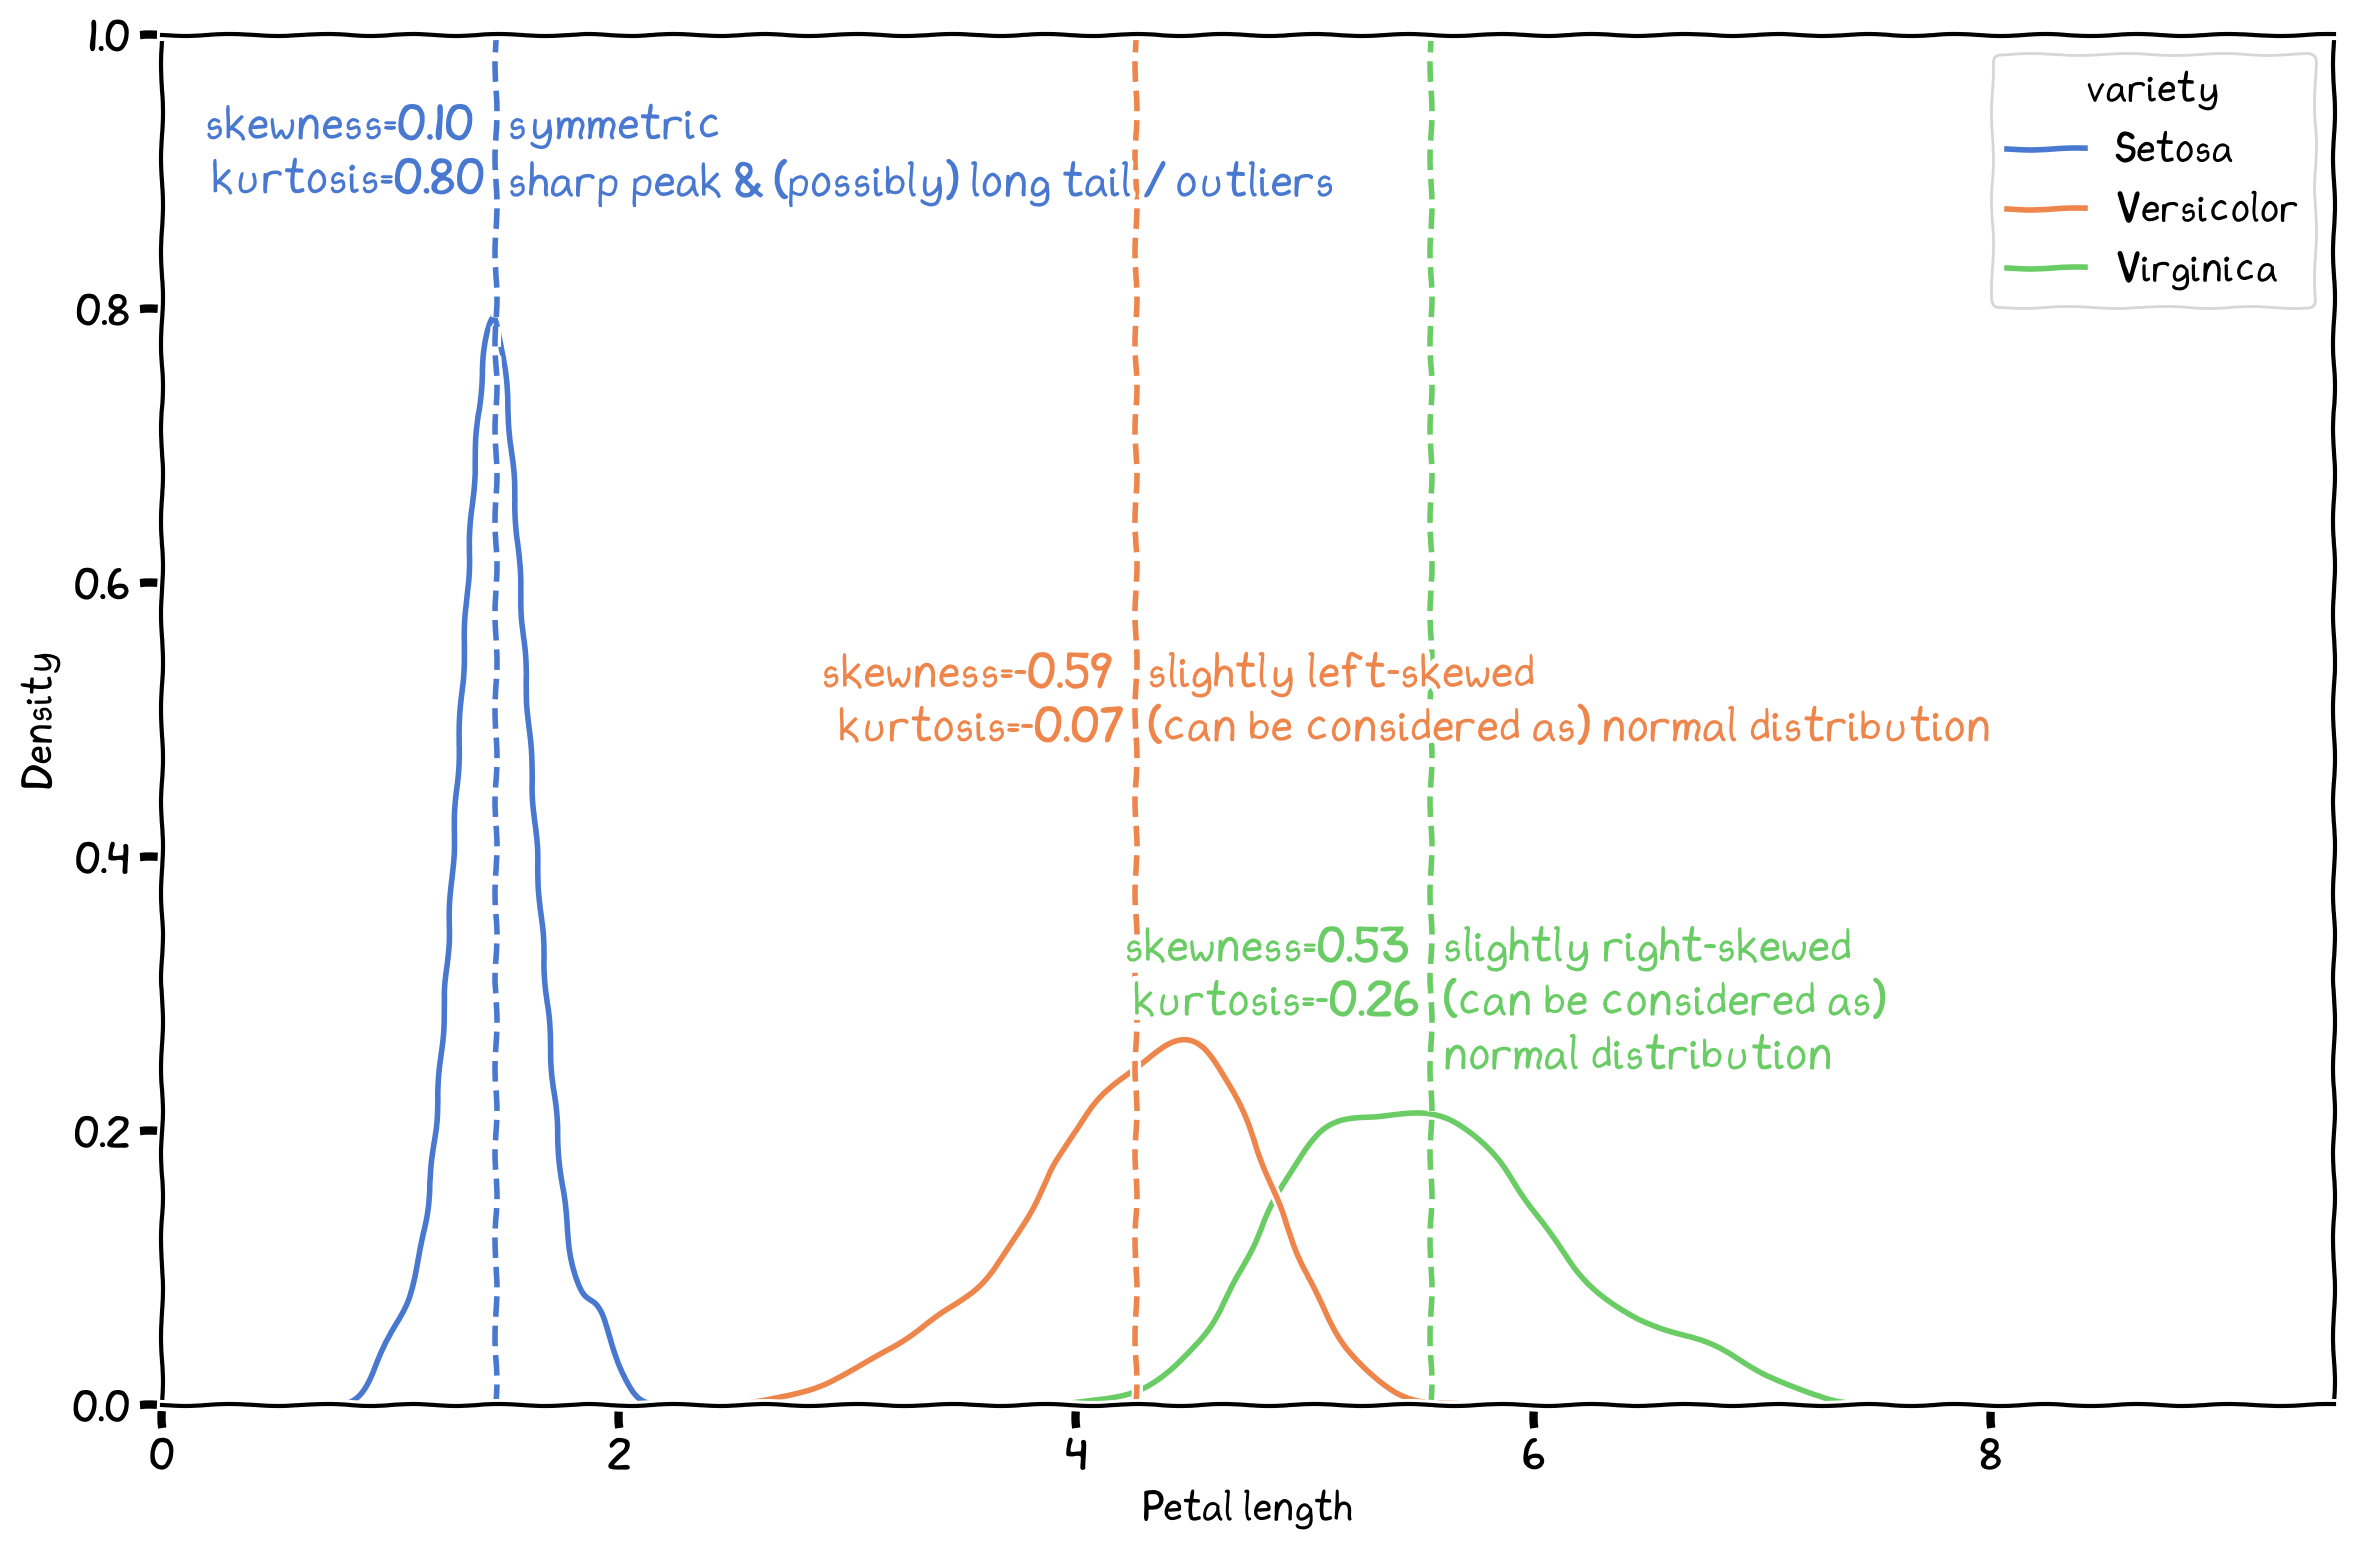
Figure 3:The skewness and kurtosis of the three IRIS species.
Inferential Statistics
Analysis of Relationship: How one variable is related to another? How a series of independent variables could be related to one of the dependent variables?
Analysis of Differences: Are them significantly different?
Analysis of Confidence: How confident are we about the sampling result?
Analysis of Relationship
Assessing the strength and direction of associations between variables. Examples include correlation (Pearson’s r for parametric data and Spearman’s rho for non-parametric data), and regression analysis (linear, multiple, and logistic regression). These output could further be used for further analysis and predictions.
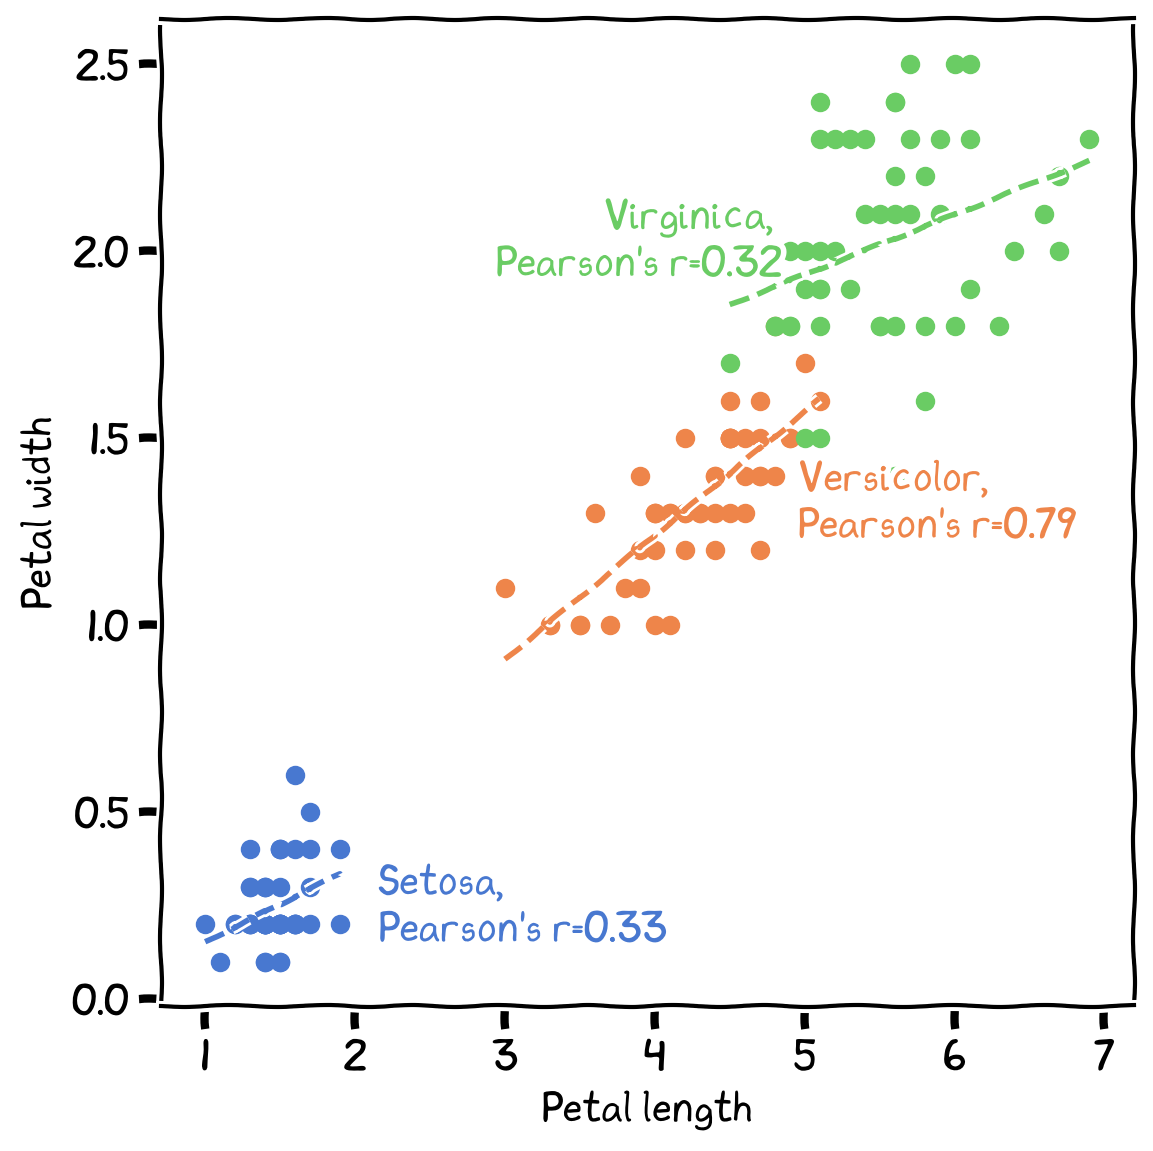
Figure 4:The relationships between petal length and petal weight for the three IRIS species.
Analysis of Differences
Evaluating whether observed differences between groups or conditions are statistically significant. Hypothesis testing forms the foundation for these measures. Parametric tests, such as t-tests and ANOVA, are used when data meets certain assumptions (e.g., normality). Non-parametric tests, such as Mann-Whitney U test, Wilcoxon signed-rank test, and Kruskal-Wallis test, are used when assumptions are violated or with non-normal data.
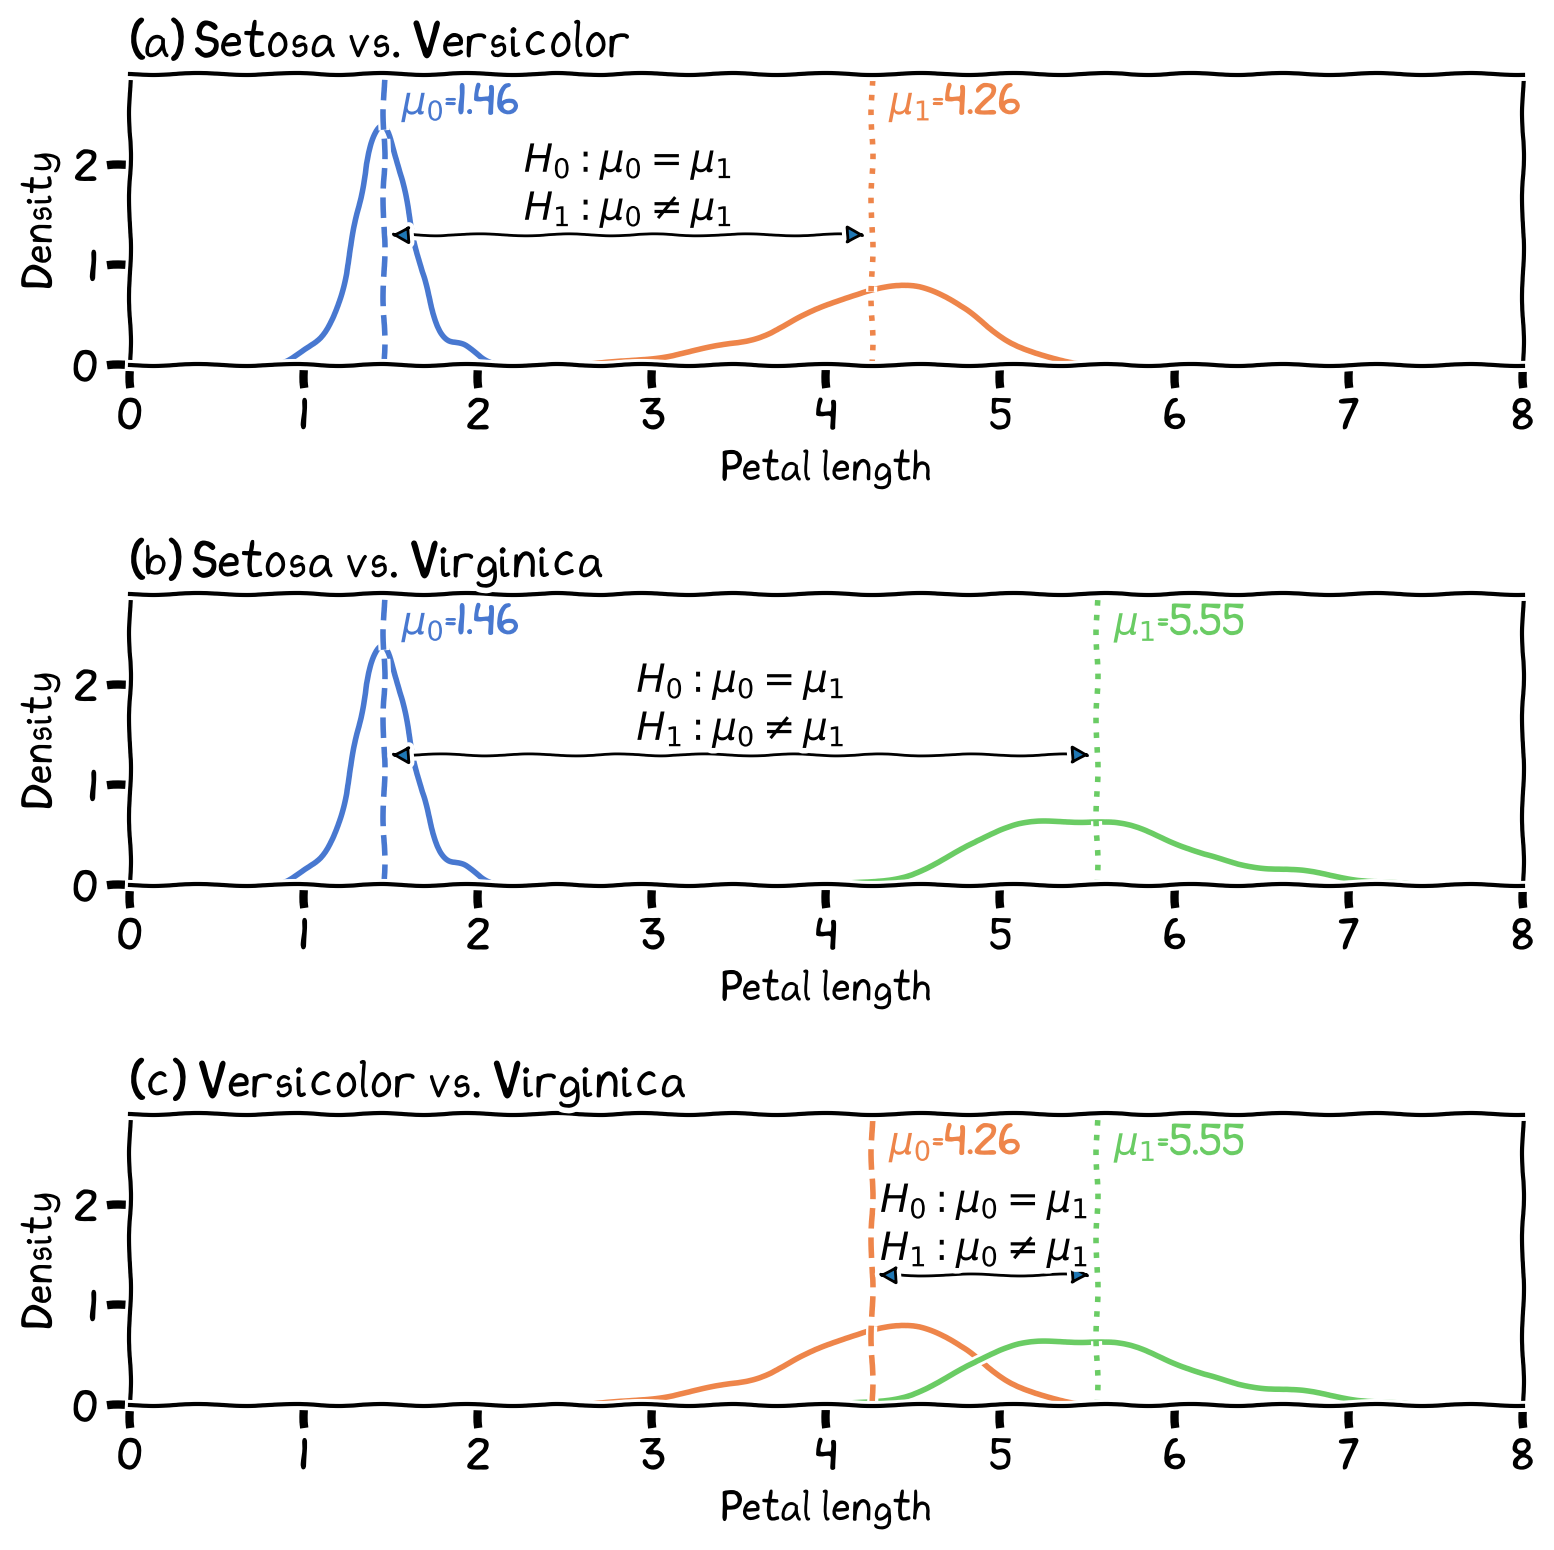
Figure 5:The differences in petal length between the three species.
Analysis of Confidence
Provide insights into the reliability and generalizability of statistical findings. Estimation involves calculating point estimates and confidence intervals to infer .red[population] parameters. Sampling distributions and standard errors help quantify the variability of sample statistics. Statistical power and effect size measures ensure that studies have adequate sample sizes and detect meaningful effects.
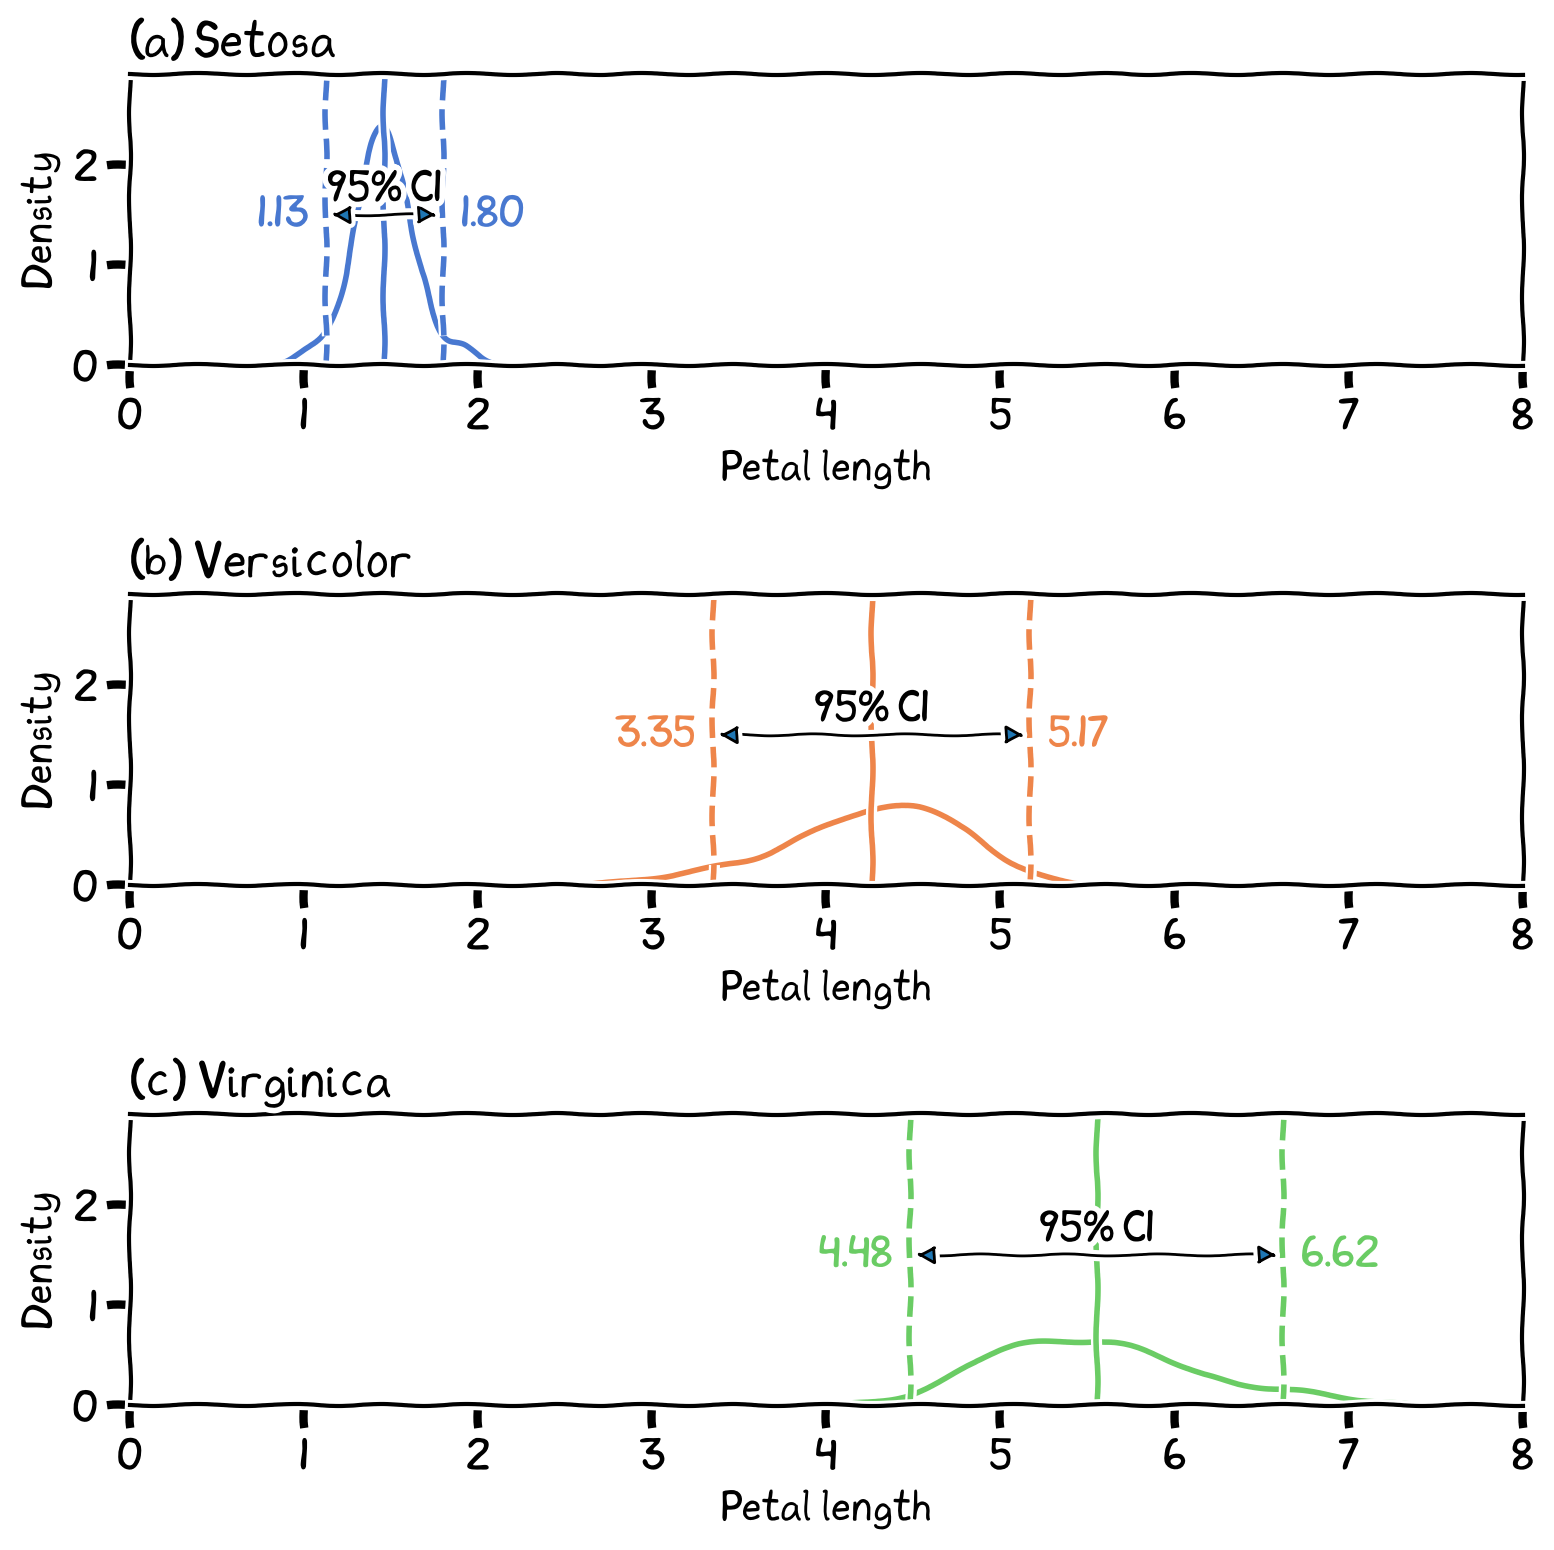
Figure 6:The confidence interval (CI) of the actual population mean could fall within the 95% CI.
Summary
Thinking Statistically while doing Geospatial Visualization
Measures of Central Tendency & Spreads: Spatial Aggregation--- What is the median resale price of HDB flats in each district?
Measures of Shape: Data Categorization--- Which data breaking scheme is more appropriate for mapping the variable? Is data transformation needed?
Analysis of Relationship: Spatial Interaction--- Is mental wellness related to the distribution of greenery? Can Socio-Economic Status be explained or predicted by the distribution of various types of POIs and property prices?
Analysis of Differences: Spatial Patterns--- Are there significant clusters of crime cases in the study area? Are the spatial patterns of university-level and secondary-school-level residences different from each other?
Analysis of Confidence: Samples vs. Population--- Is the sample data representative of the population?
These are some of the key concerns when we are reading/mapping a spatial pattern.