What is Data Transformation
Definition: Data transformation is the process of converting data from one form or scale to another to improve analysis and interpretation.
Purpose:
To meet the assumptions of statistical tests,
handle the scale of data range differences,
enhance the performance of machine learning models,
etc.
Importance: Proper data transformation can significantly affect the quality of insights derived from data analysis and modeling.
Common data transformation techniques
Min-Max Scaling
Standardization
Log transformation
Box-Cox transformation
Ranking data transformation
Min-Max Scaling
Definition and purpose: Min-max scaling is a popular data normalization technique that transforms features to fall within a specific range, typically between 0 and 1.
Equation:
Where:
is the scaled value of the feature .
is the original value of the feature.
is the minimum value of the feature across all samples.
is the maximum value of the feature across all samples.
& is the new minimum and maximum values, respectively, for the target range.
When to use: Normalizing data to a specific range and preserving original shape.
Min-Max Scaling
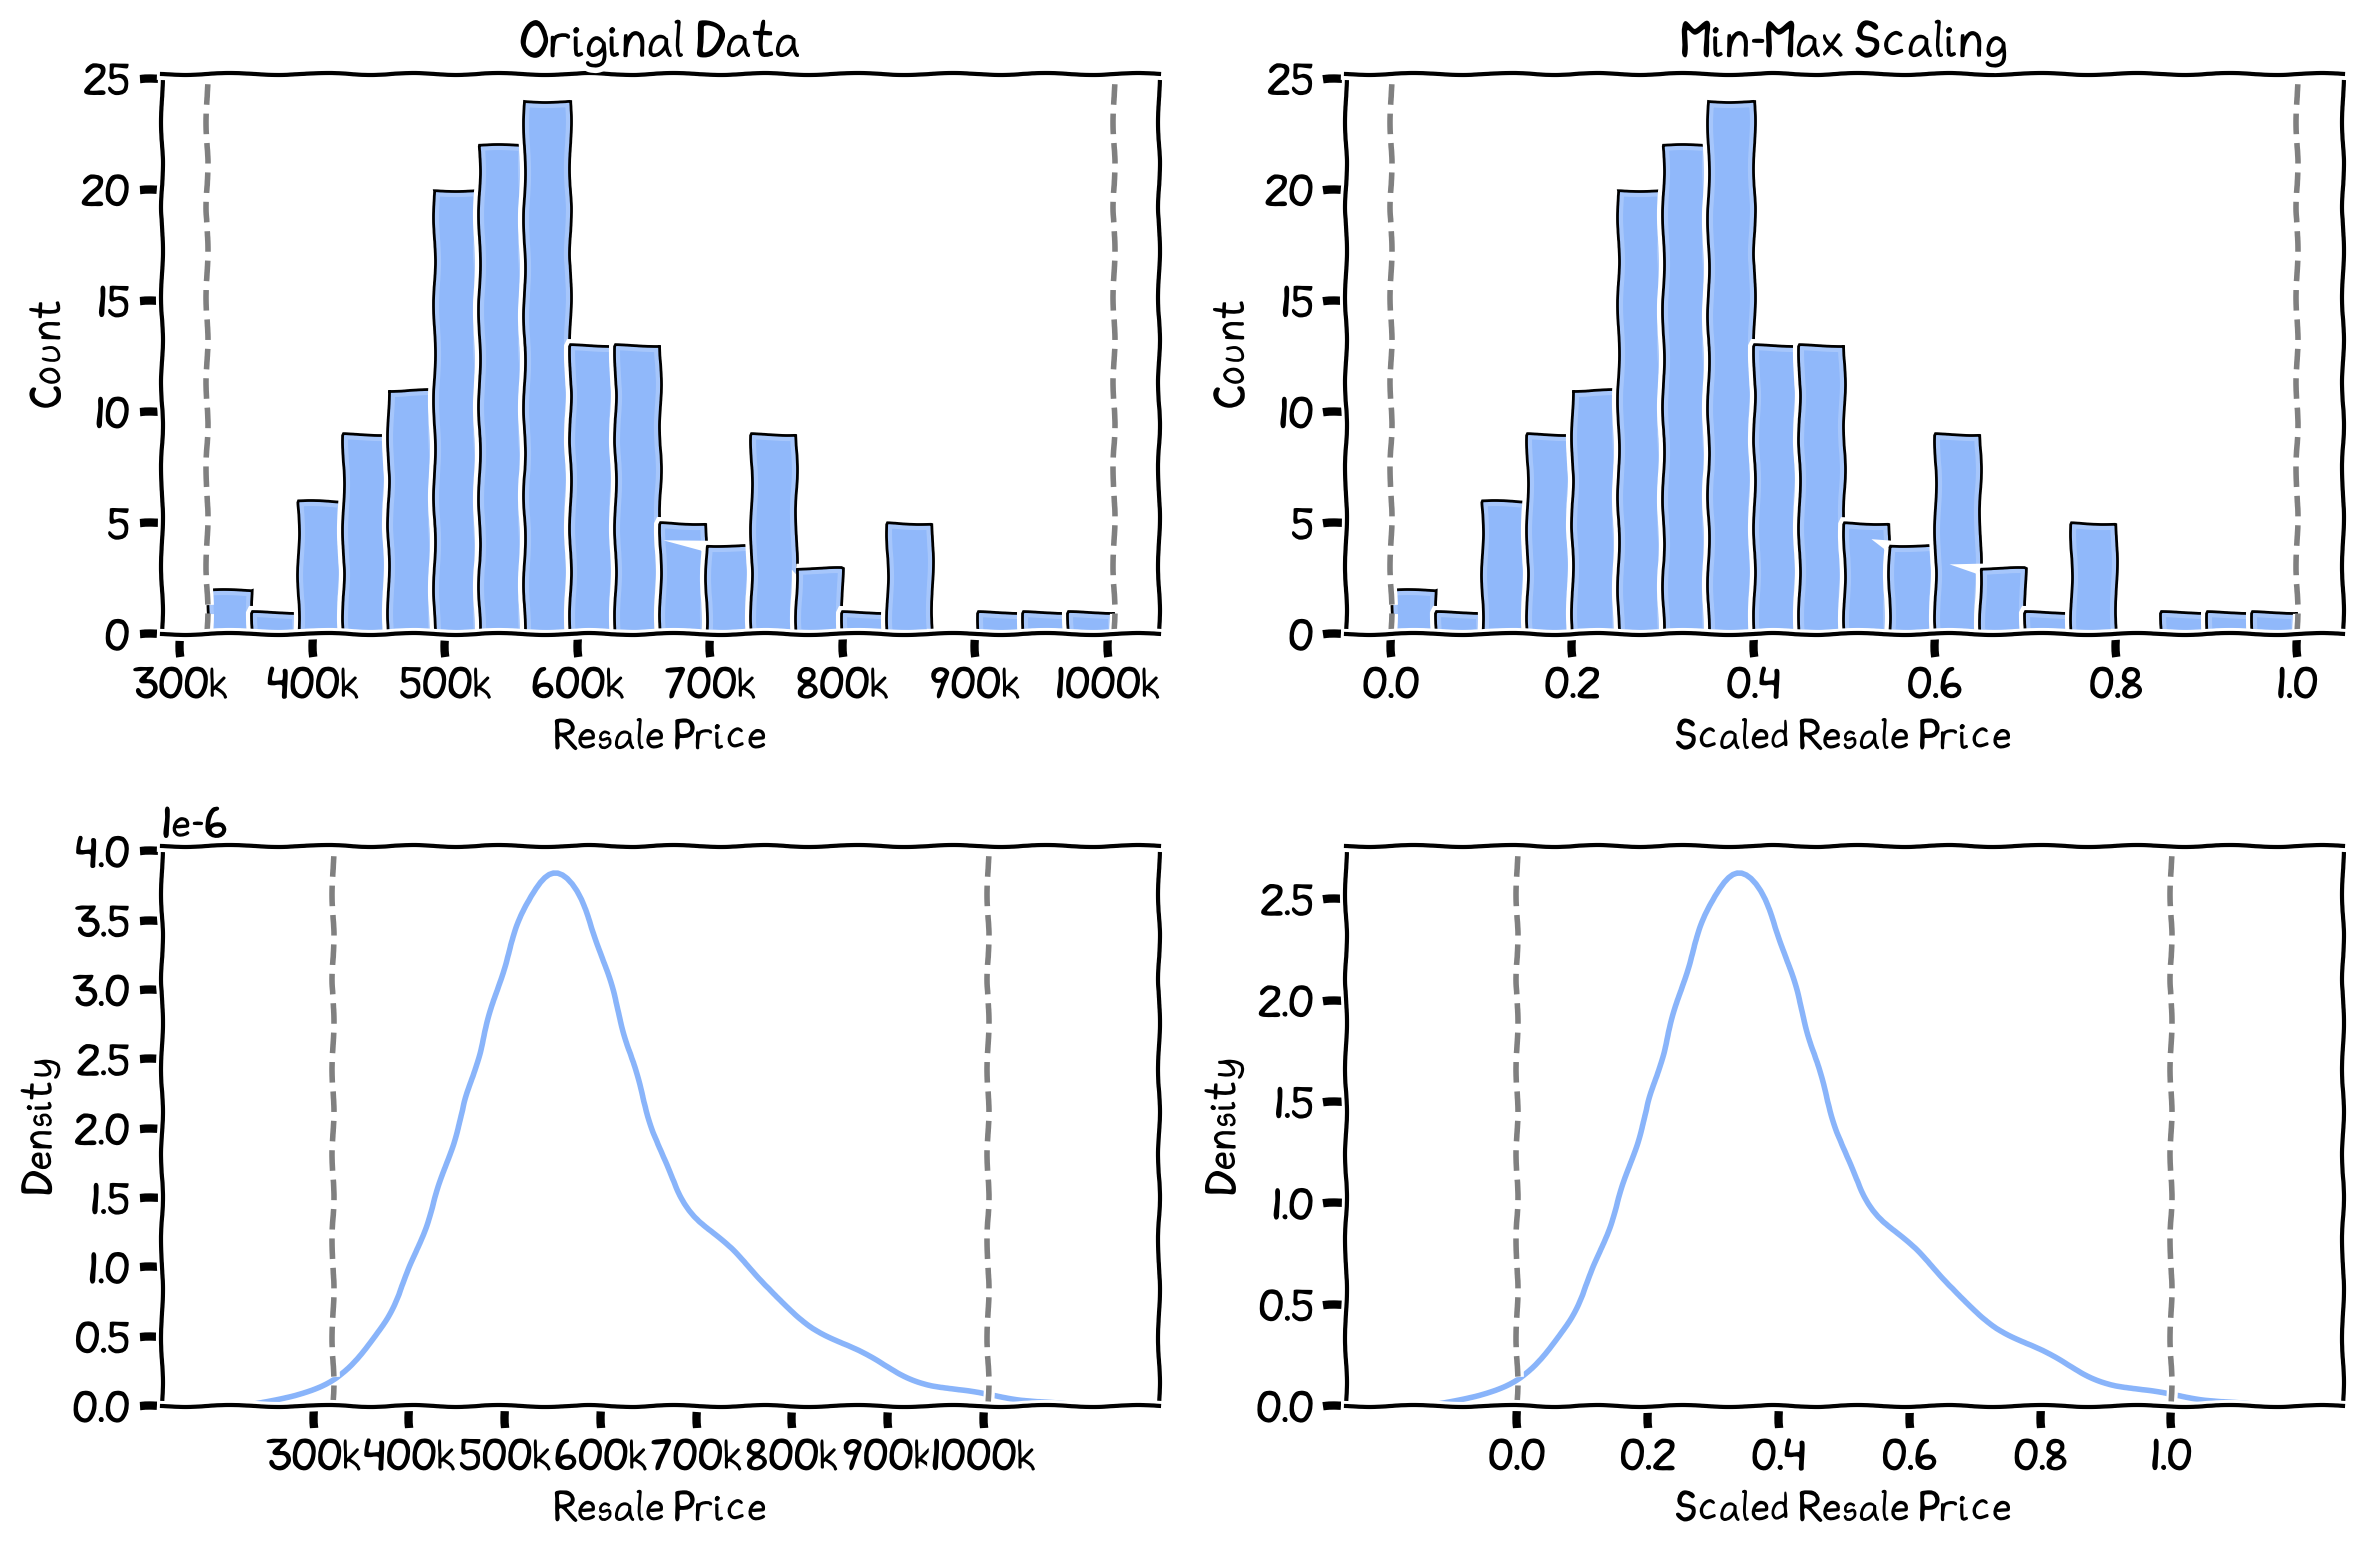
The histogram (top) and PDF (bottom) of the average subzone resale price before (left) and after (right) min-max scaling.
Advantages:
Simple,
easy to understand,
preserves shape.
Disadvantages:
Sensitive to outliers,
less robust.
Standardization
Definition and purpose: Standardization (aka Z-score normalization) is a data transformation technique that scales features to have zero mean and unit variance. Its purpose is to make different features comparable by transforming them to a common scale.
Equation:
Where:
is the original feature value.
is the mean of the feature values.
is the standard deviation of the feature values.
.When to use:
When working with features measured on different scales (e.g., age, income, and temperature).
When using machine learning algorithms that are sensitive to feature scales, such as linear discriminant analysis, logistic regression, or principal component analysis.
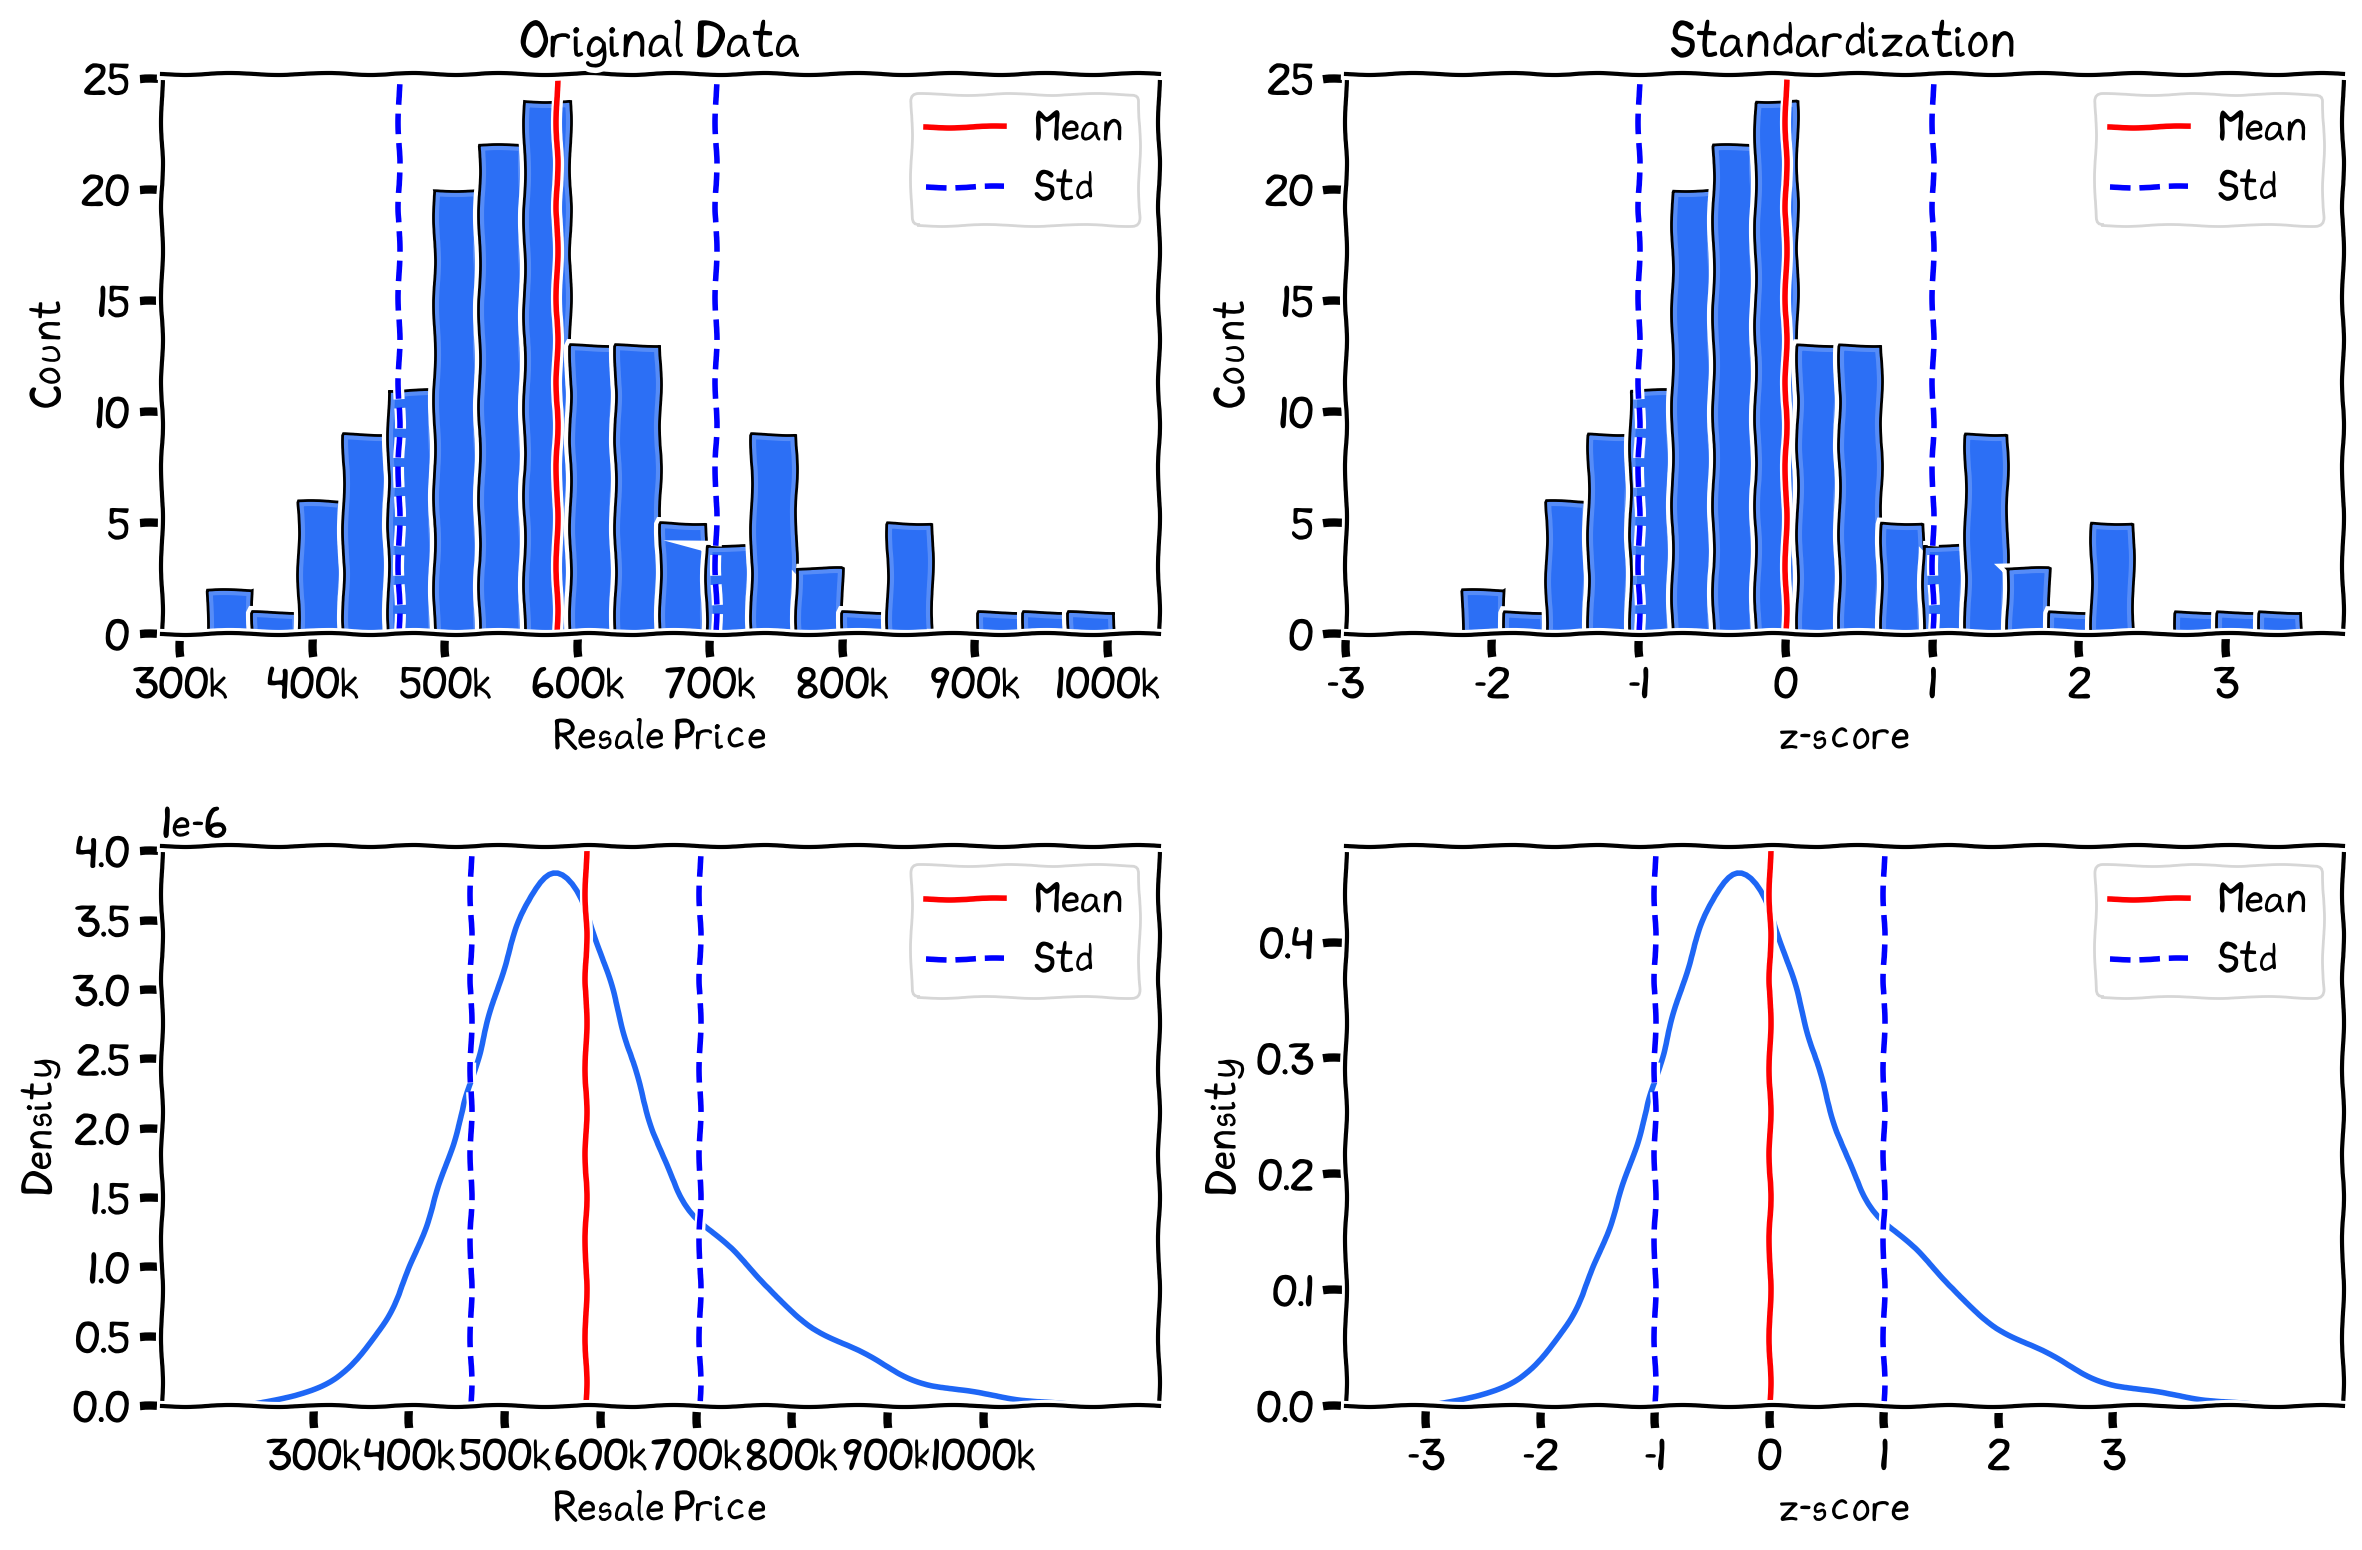
The histogram (top) and PDF (bottom) of the average subzone resale price before (left) and after (right) standardization.
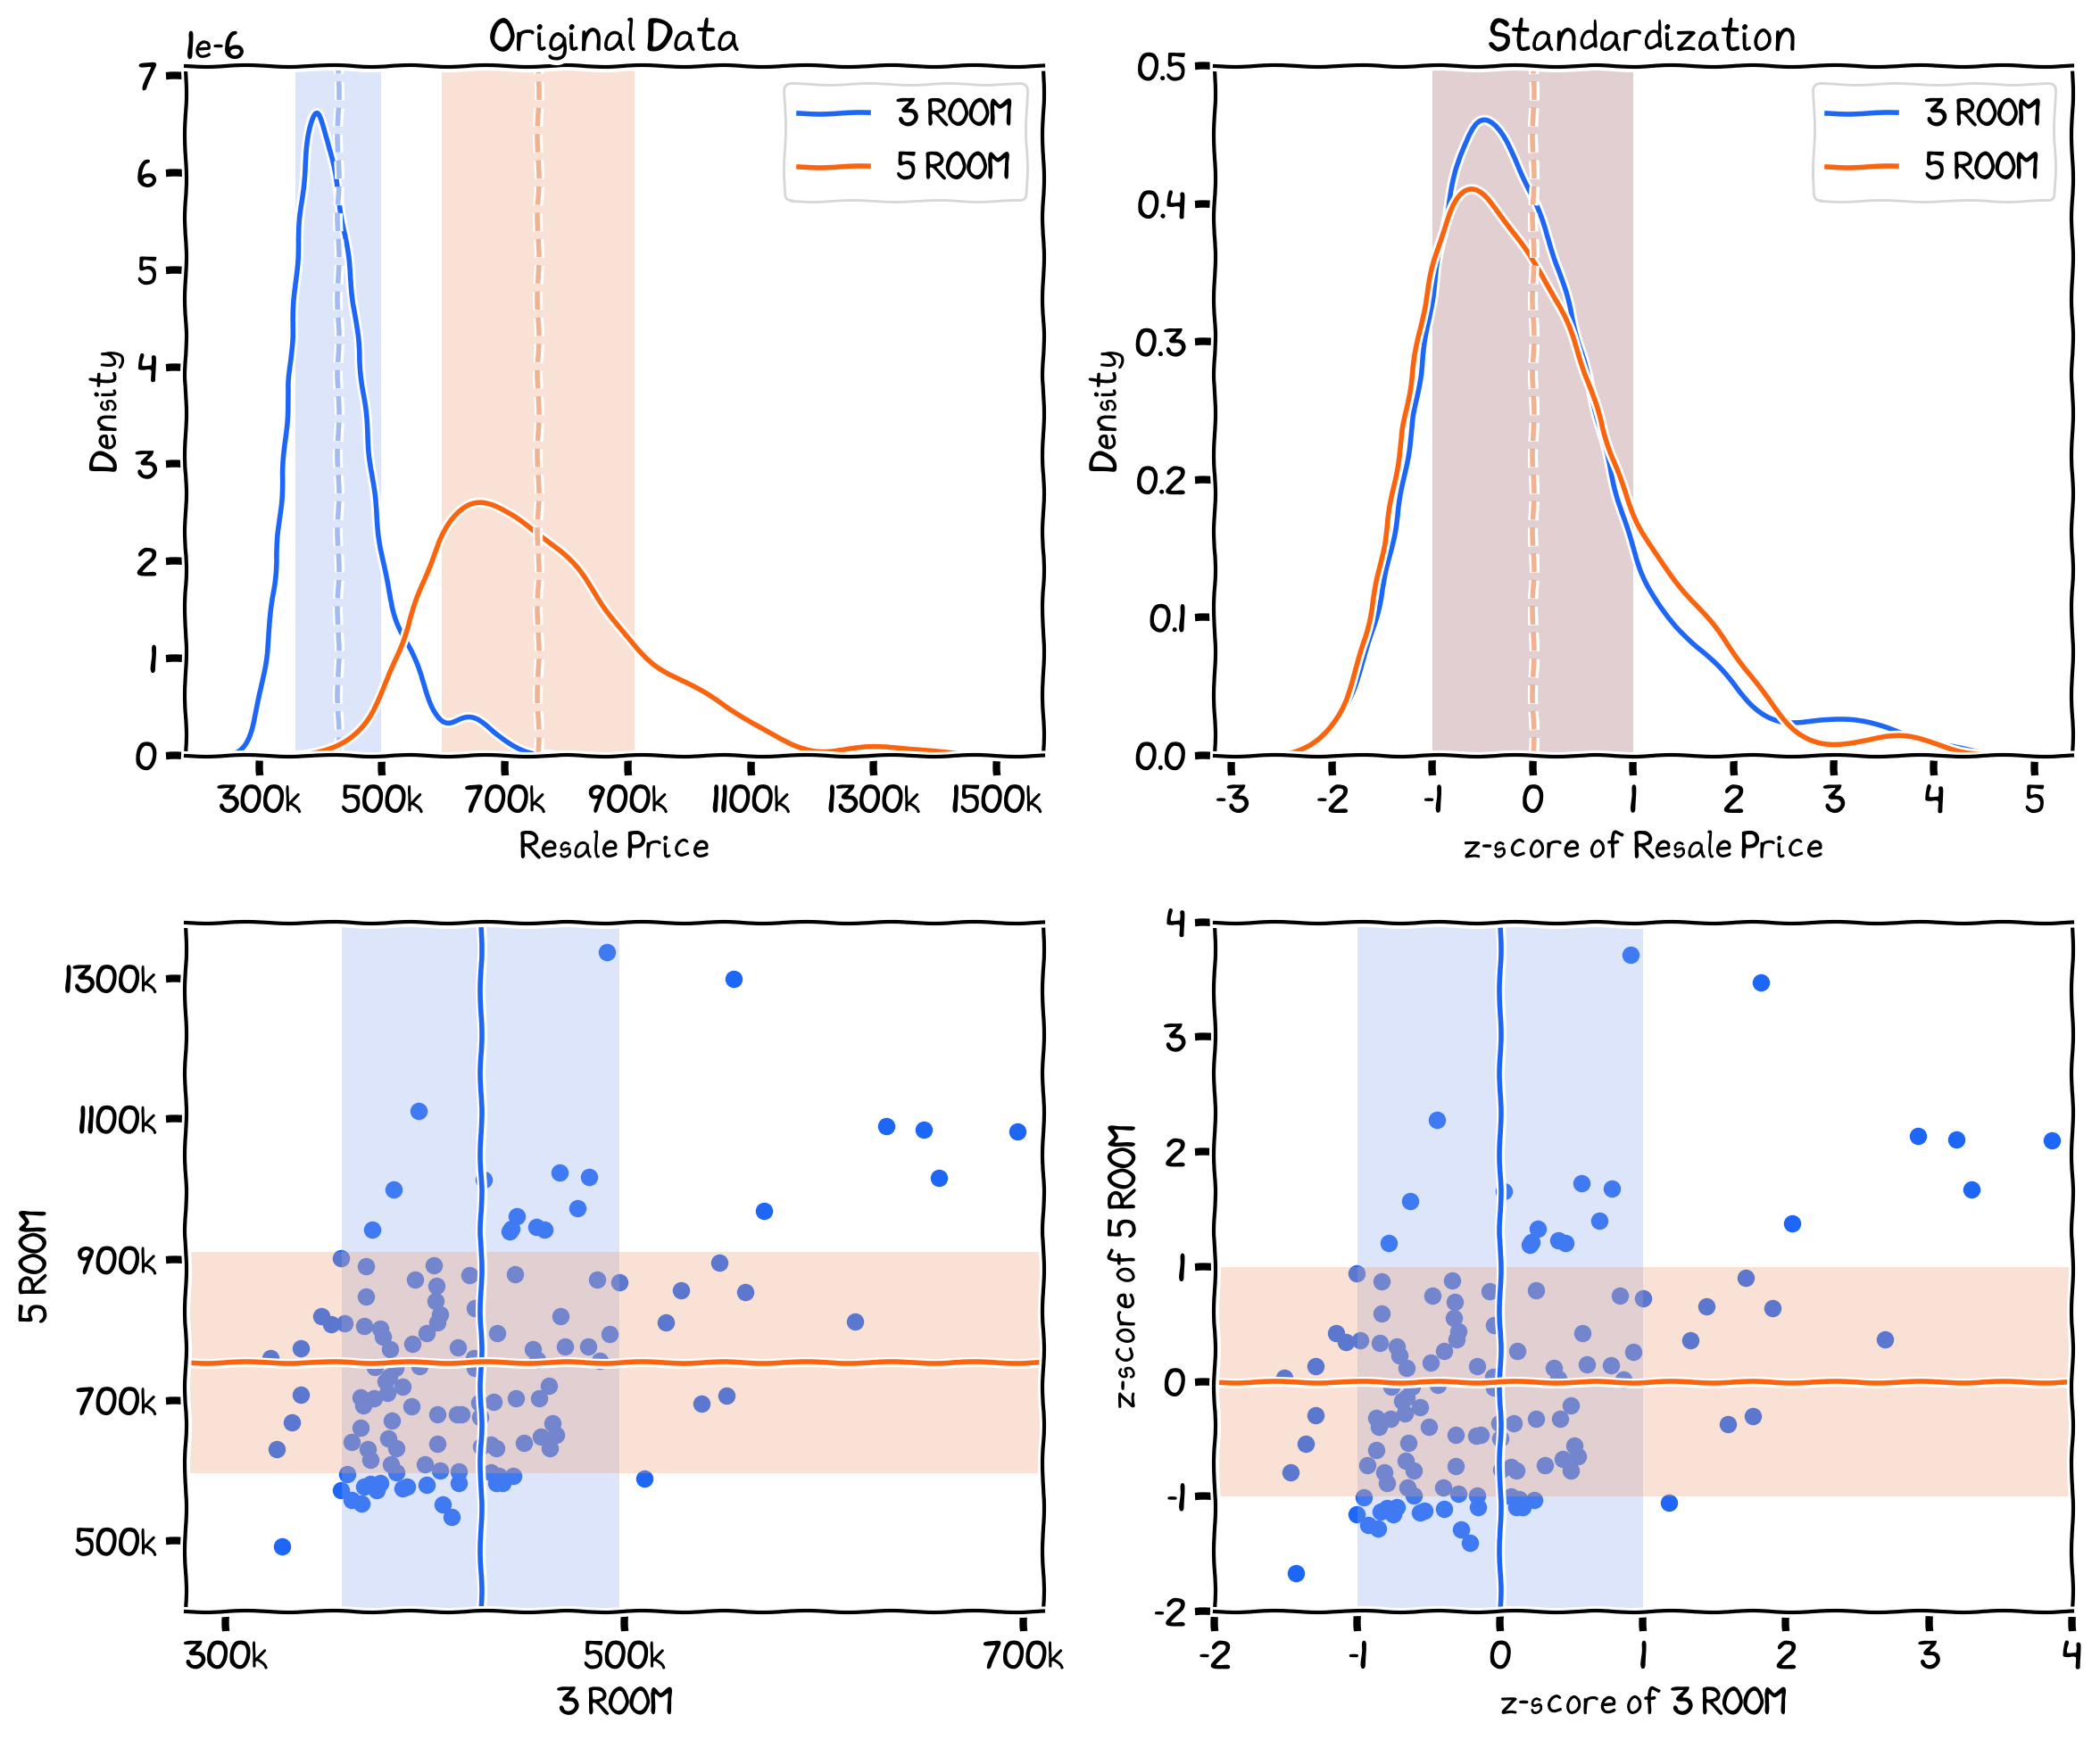
The PDF (top) of the average subzone resale price of 3 rooms and 5 rooms HDB flat before (left) and after (right) standardization. The two scatter plots at the bottom show the relationship between 3 and 5 room HDB flat.
Advantages:
Unit variance and zero mean
Dimensionless (unitless)
Robust to outliers
(potentially) Reduces multicollinearity.
Disadvantages:
Removed original scale and unit
Sensitive to new data
Not suitable for non-normal/non-linear data
(potentially) Not suitable for data crossing zero
Log Transformation
Definition and Purpose: Log transformation is a data transformation technique that applies the natural logarithm to the original data. It helps to reduce skewness in the data and stabilize variance for statistical analysis or modeling.
Equation:
Where:
could use various base for the log, common options include 2, 10, or e (natural log)
When to Use:
When the data is positively skewed or has a wide range of values.
When the relationship between two variables can be better modeled using a logarithmic scale.
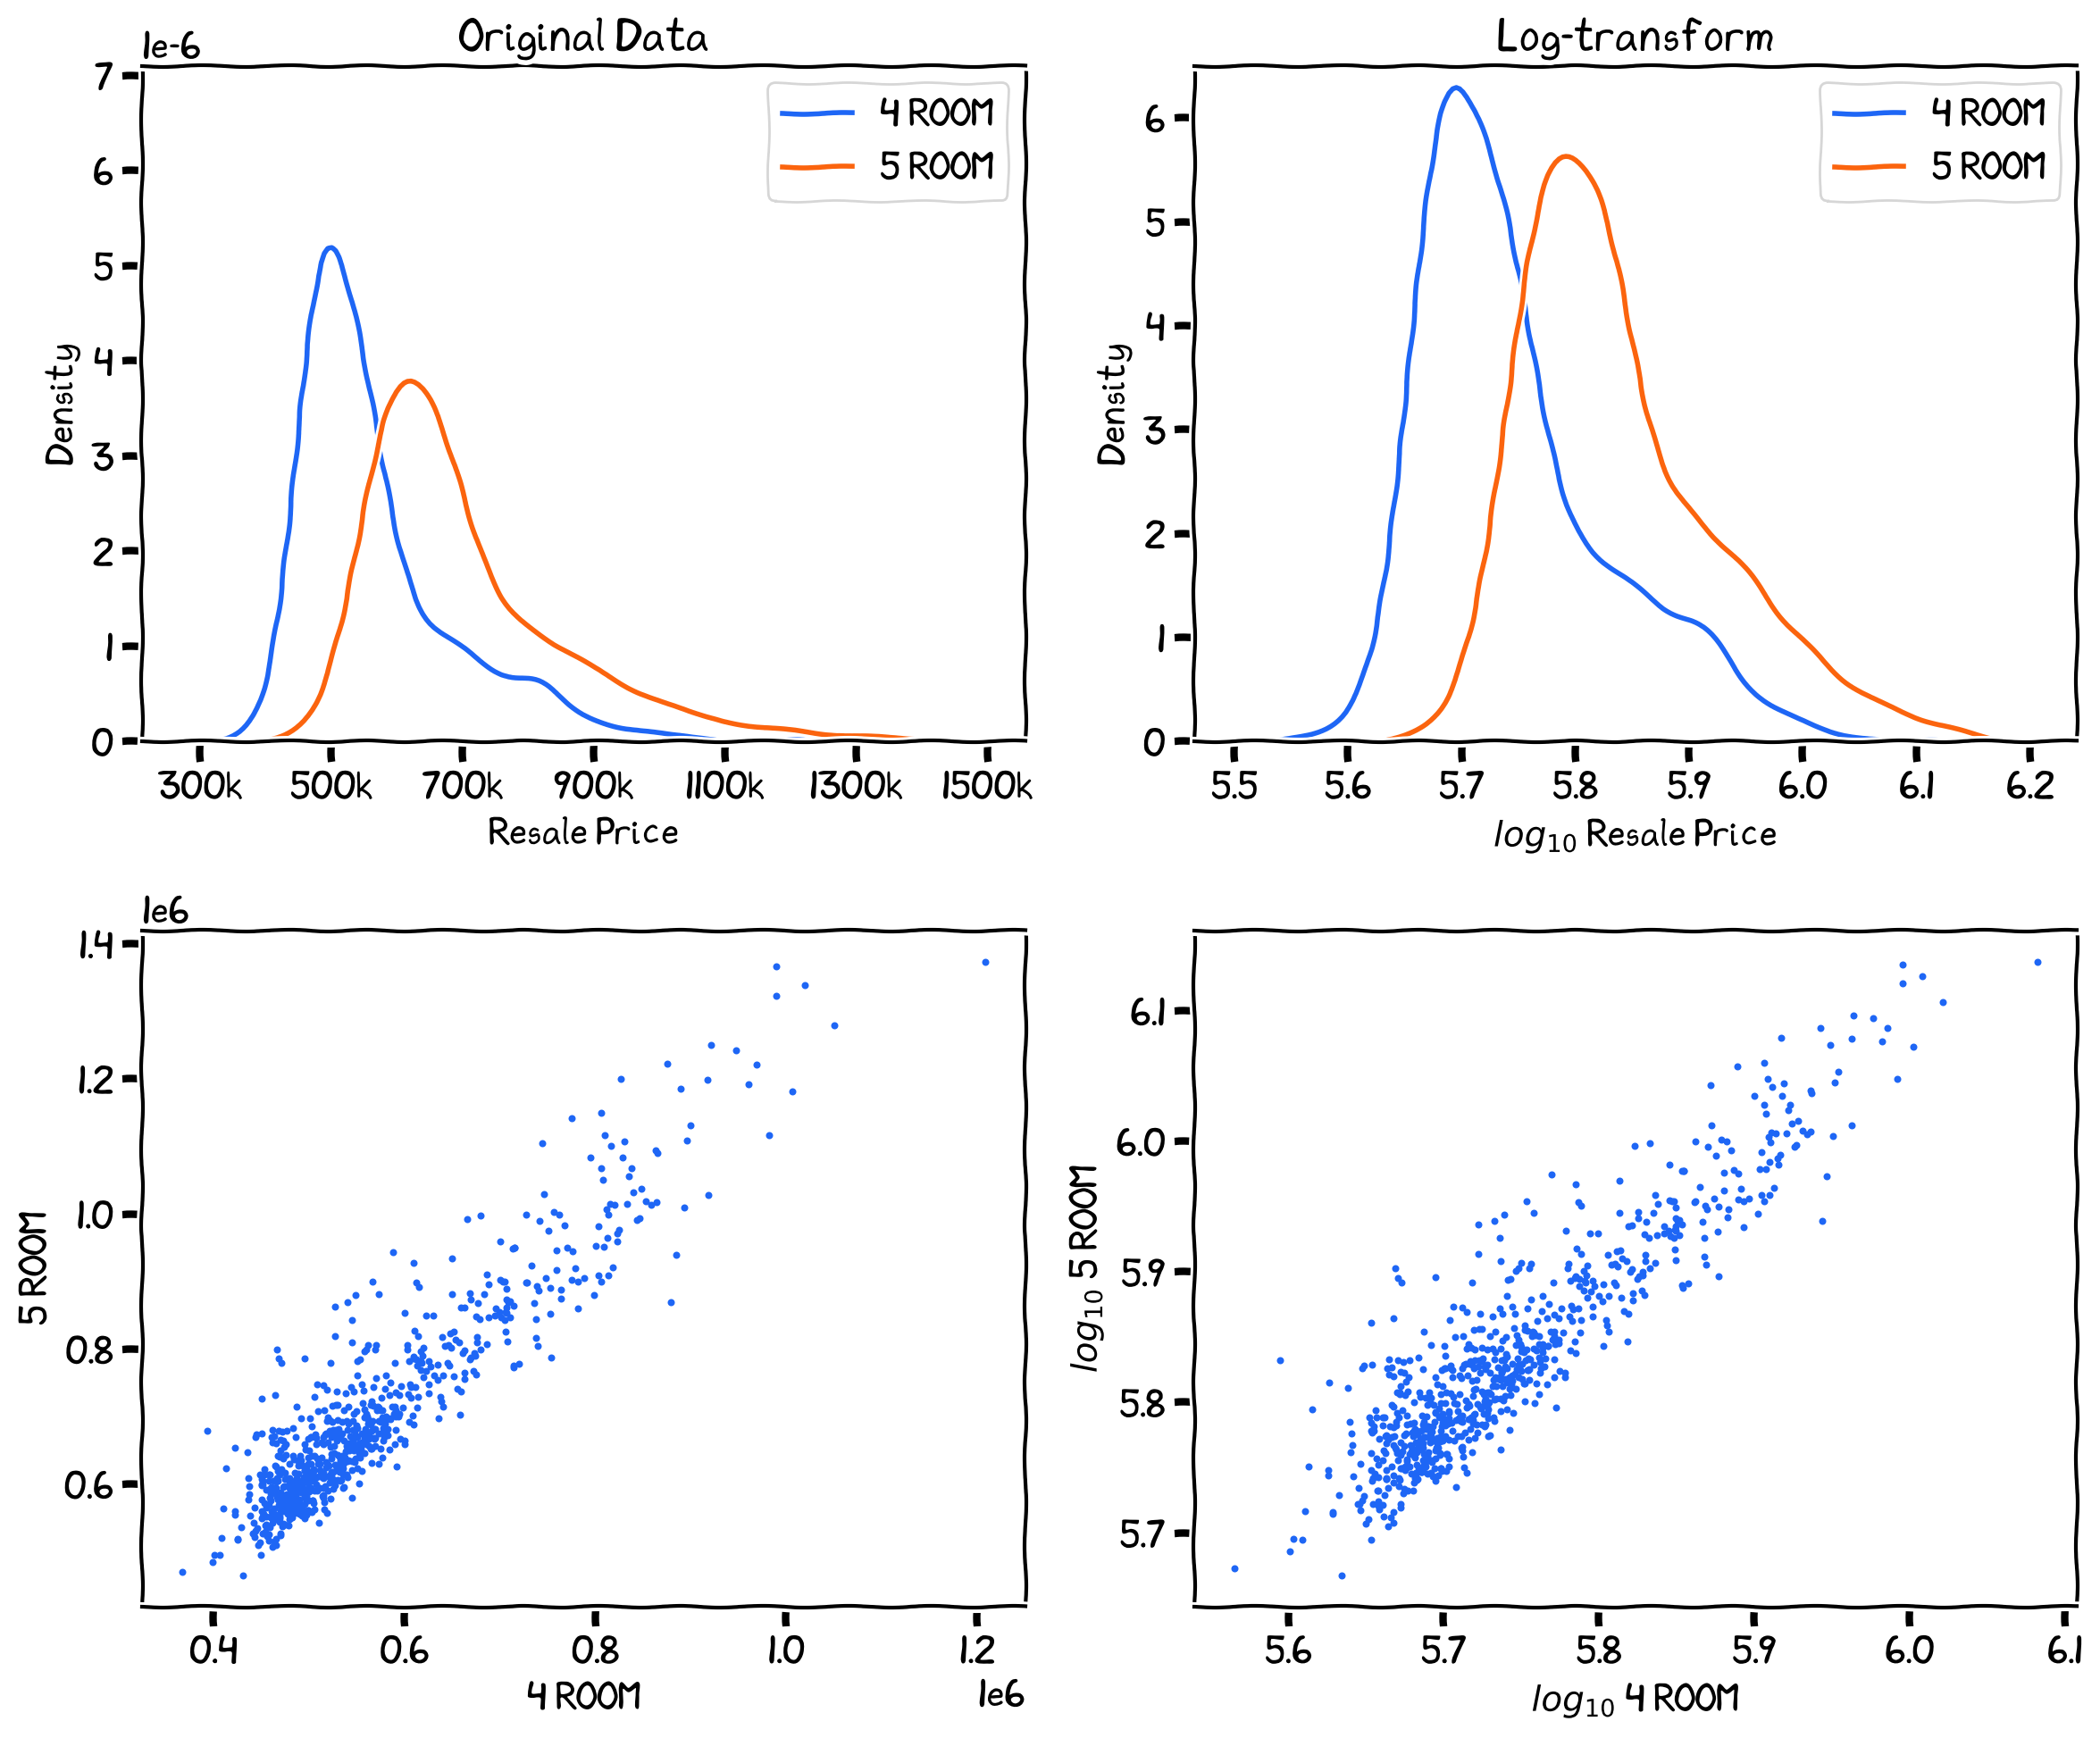
The before (left) and after (right) log-transformed of resale prices.
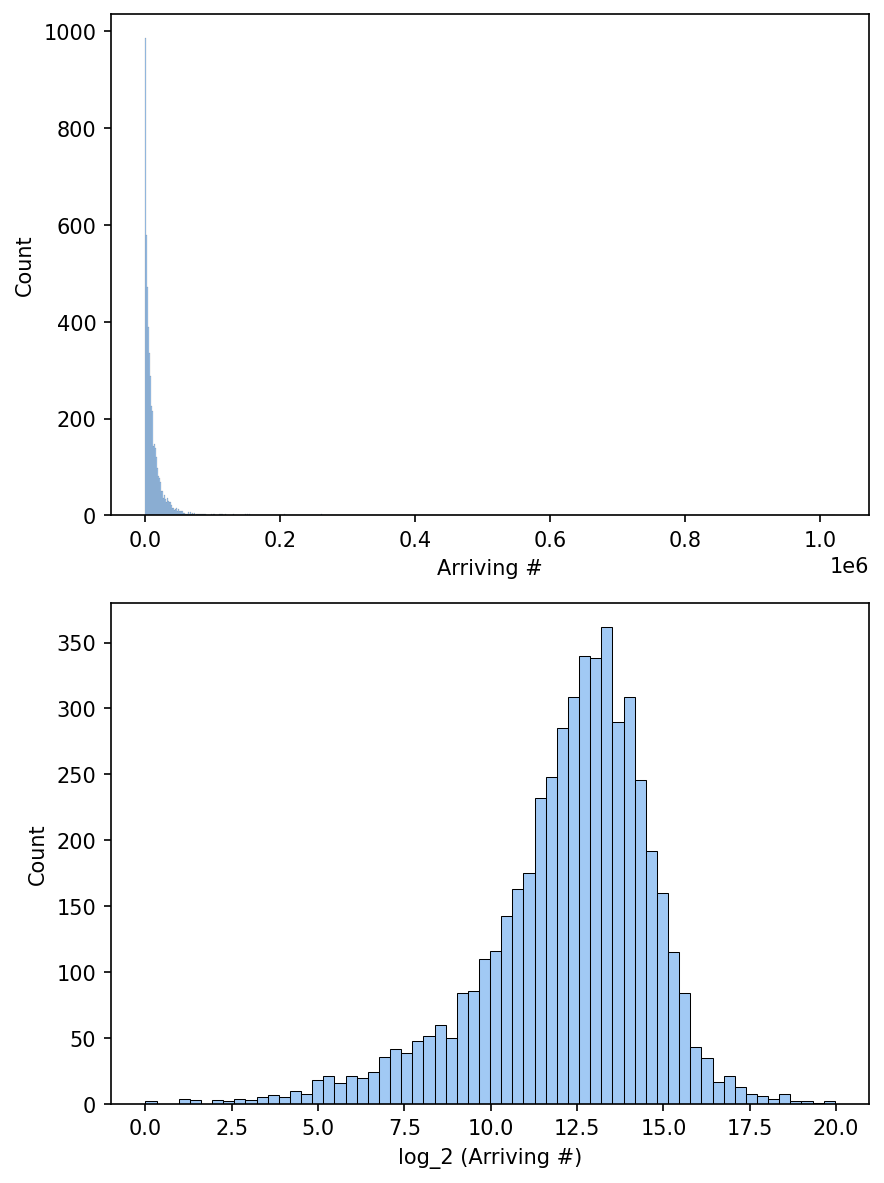
The before (top) and after (bottom) log-transformed of ridership (arrival passsenger).
Advantages
Reduces skewness in data.
Helps stabilize variance.
Can improve linearity in relationships between variables.
Disadvantages
Distorts the original scale of data, making interpretation more challenging.
Cannot be applied to negative values or zero.
The choice of logarithm base (e, 2, 10) may affect results and interpretation.
Box-Cox
Definition and Purpose: Box-Cox transformation is a power transformation technique that can stabilize variance and make data more normally distributed. It is a family of transformations that includes the logarithmic () and square root () transformations as special cases.
Equation:
When to Use:
When the data is not normally distributed or has varying degrees of skewness or kurtosis.
When trying to linearize relationships between variables or equalize variances across groups.
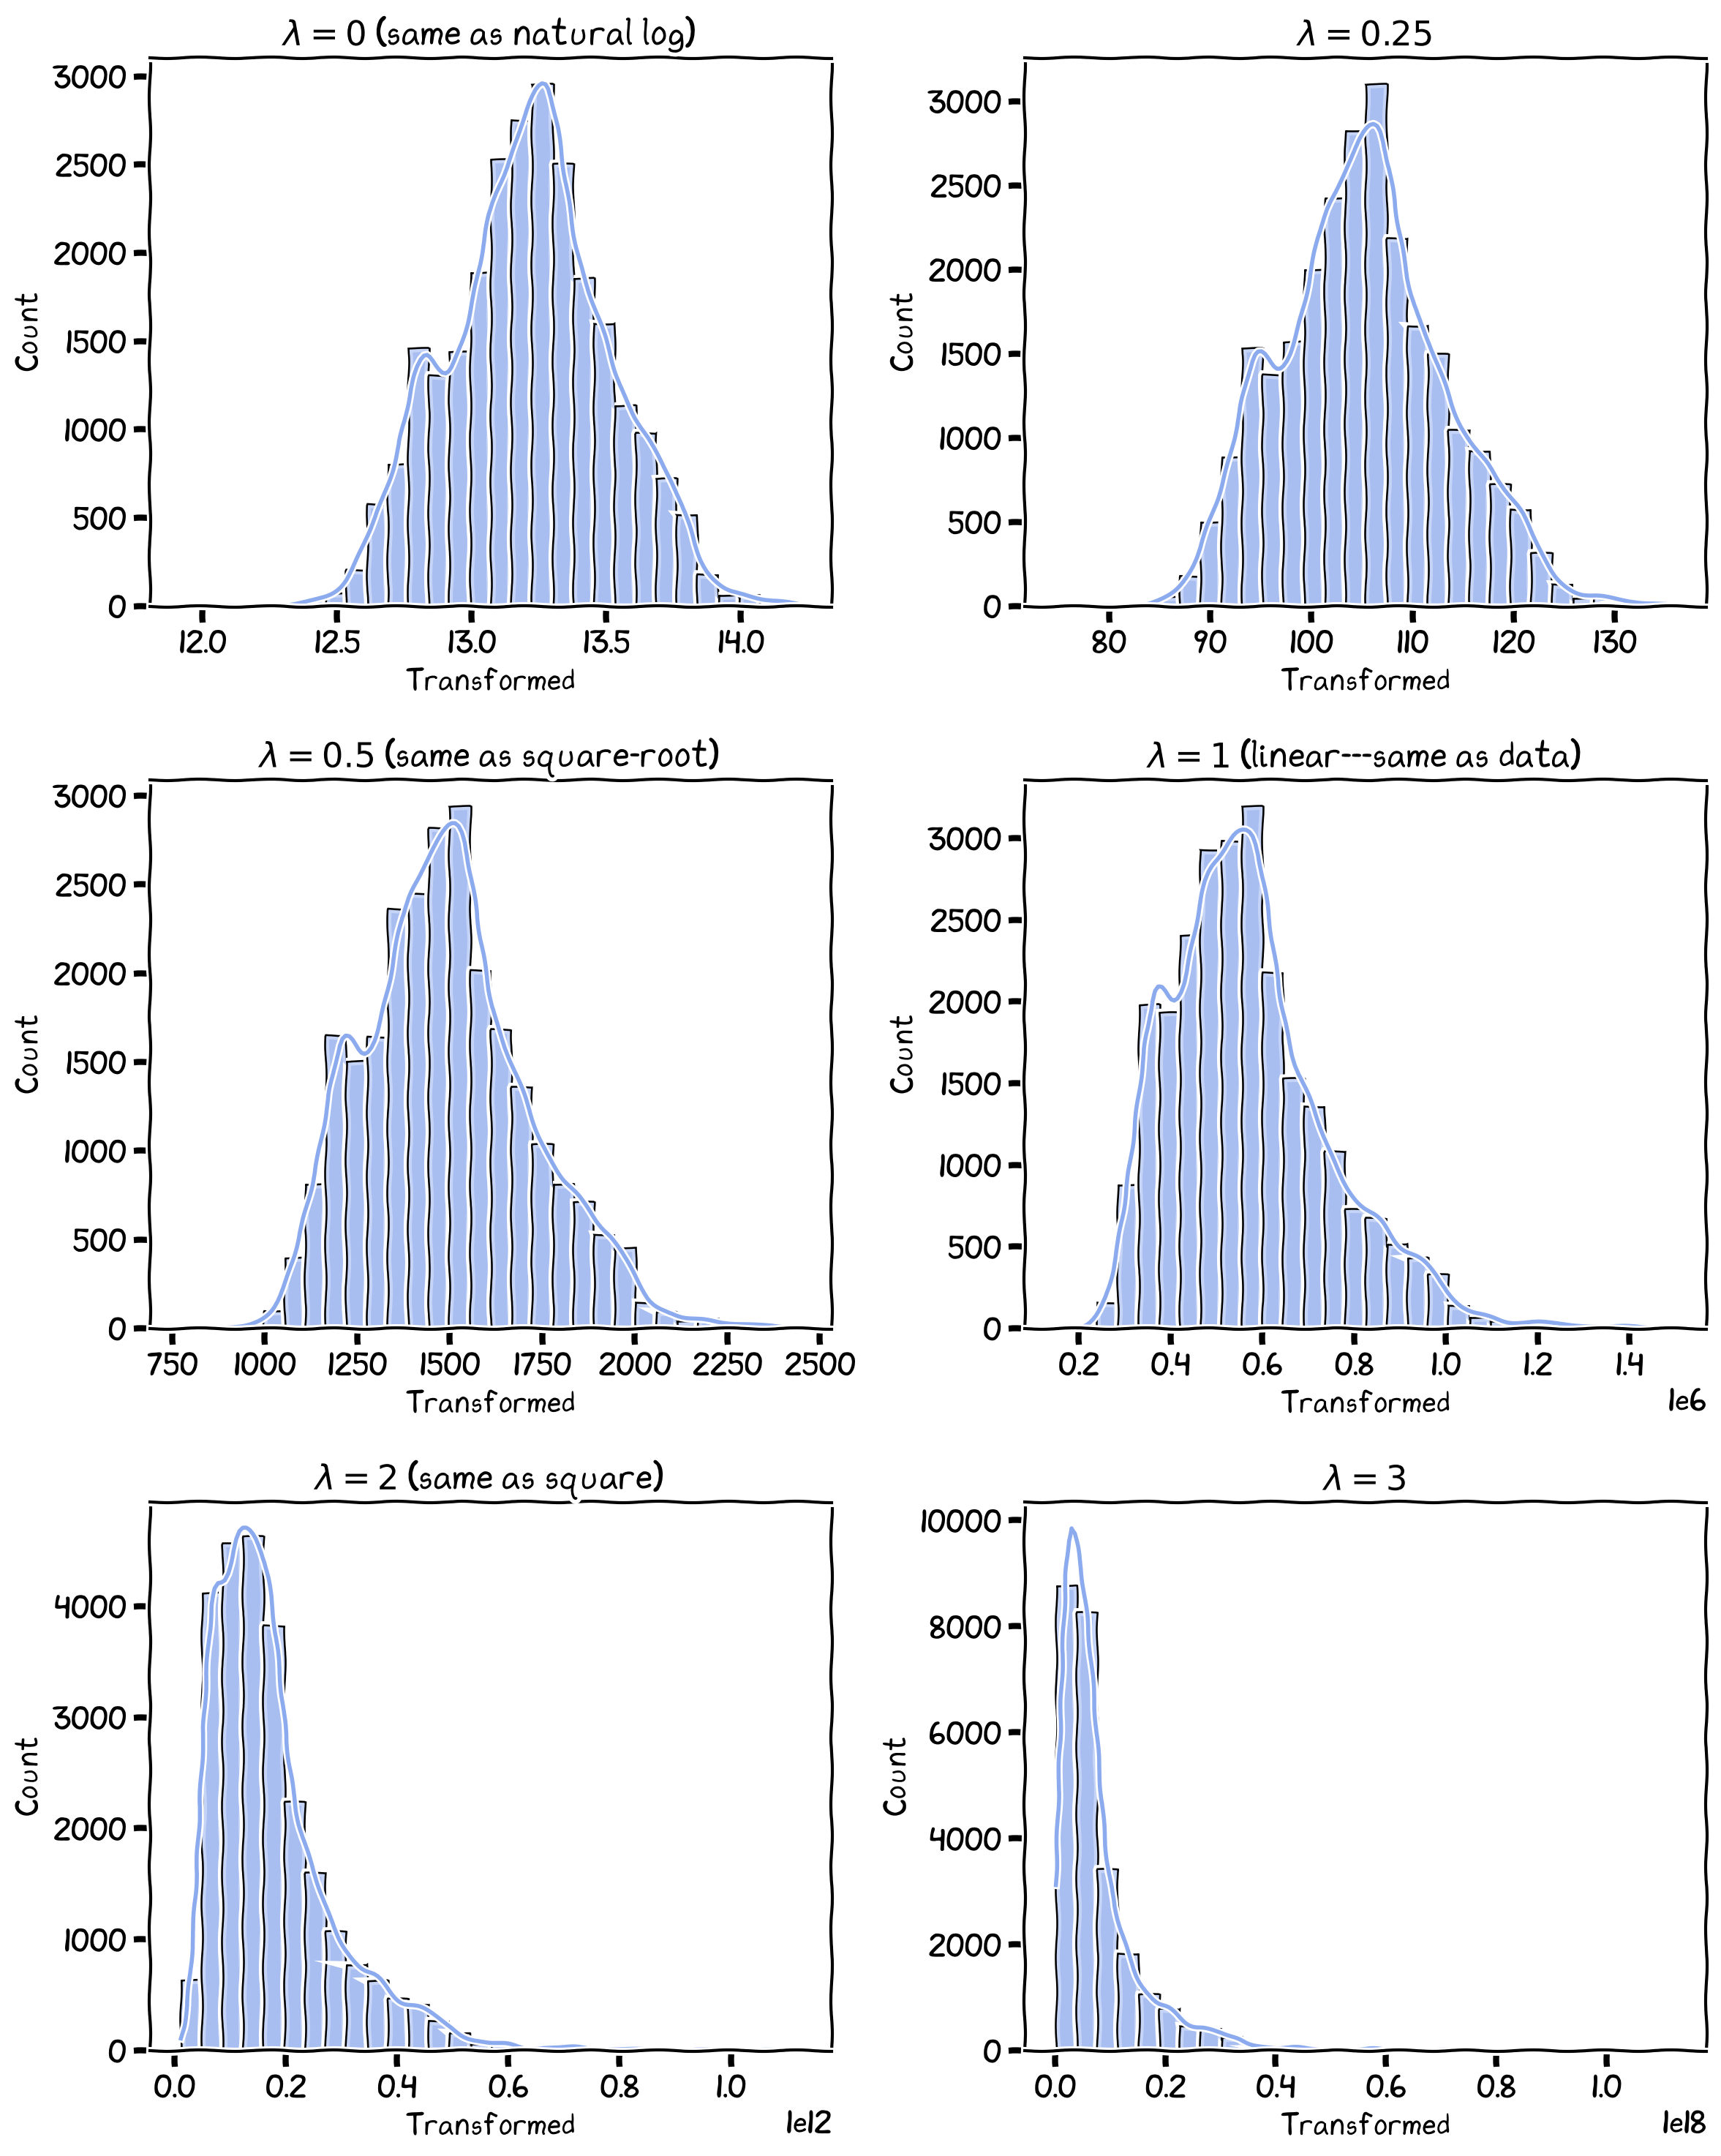
Histogram of Box-Cox transformed values, with set to: 0, 0.25, 0.5, 1, 2, 3.
Advantages
Can handle various degrees of skewness and kurtosis.
Provides flexibility to choose the best transformation based on data characteristics.
Includes logarithmic and square root transformations as special cases.
Disadvantages
Requires estimating the optimal lambda parameter, which can be time-consuming.
Loses some interpretability due to data transformation.
May not always provide a significant improvement in data normality.
How to determine which is the best?
Ranking Data Transformation
Definition and Purpose: Ranking data transformation replaces original values with their corresponding ranks, preserving the order or hierarchy of the data. It can help in data visualization, feature engineering, or non-parametric statistical tests.
How it works: There is no explicit equation for ranking data transformation. The process involves sorting the values and assigning ranks based on their positions in the sorted list. In case of ties, you can use methods like average, min, or max ranking.
When to Use: When working with ordinal data or categorical data that can be ordered. When performing non-parametric statistical tests that require ranked data.
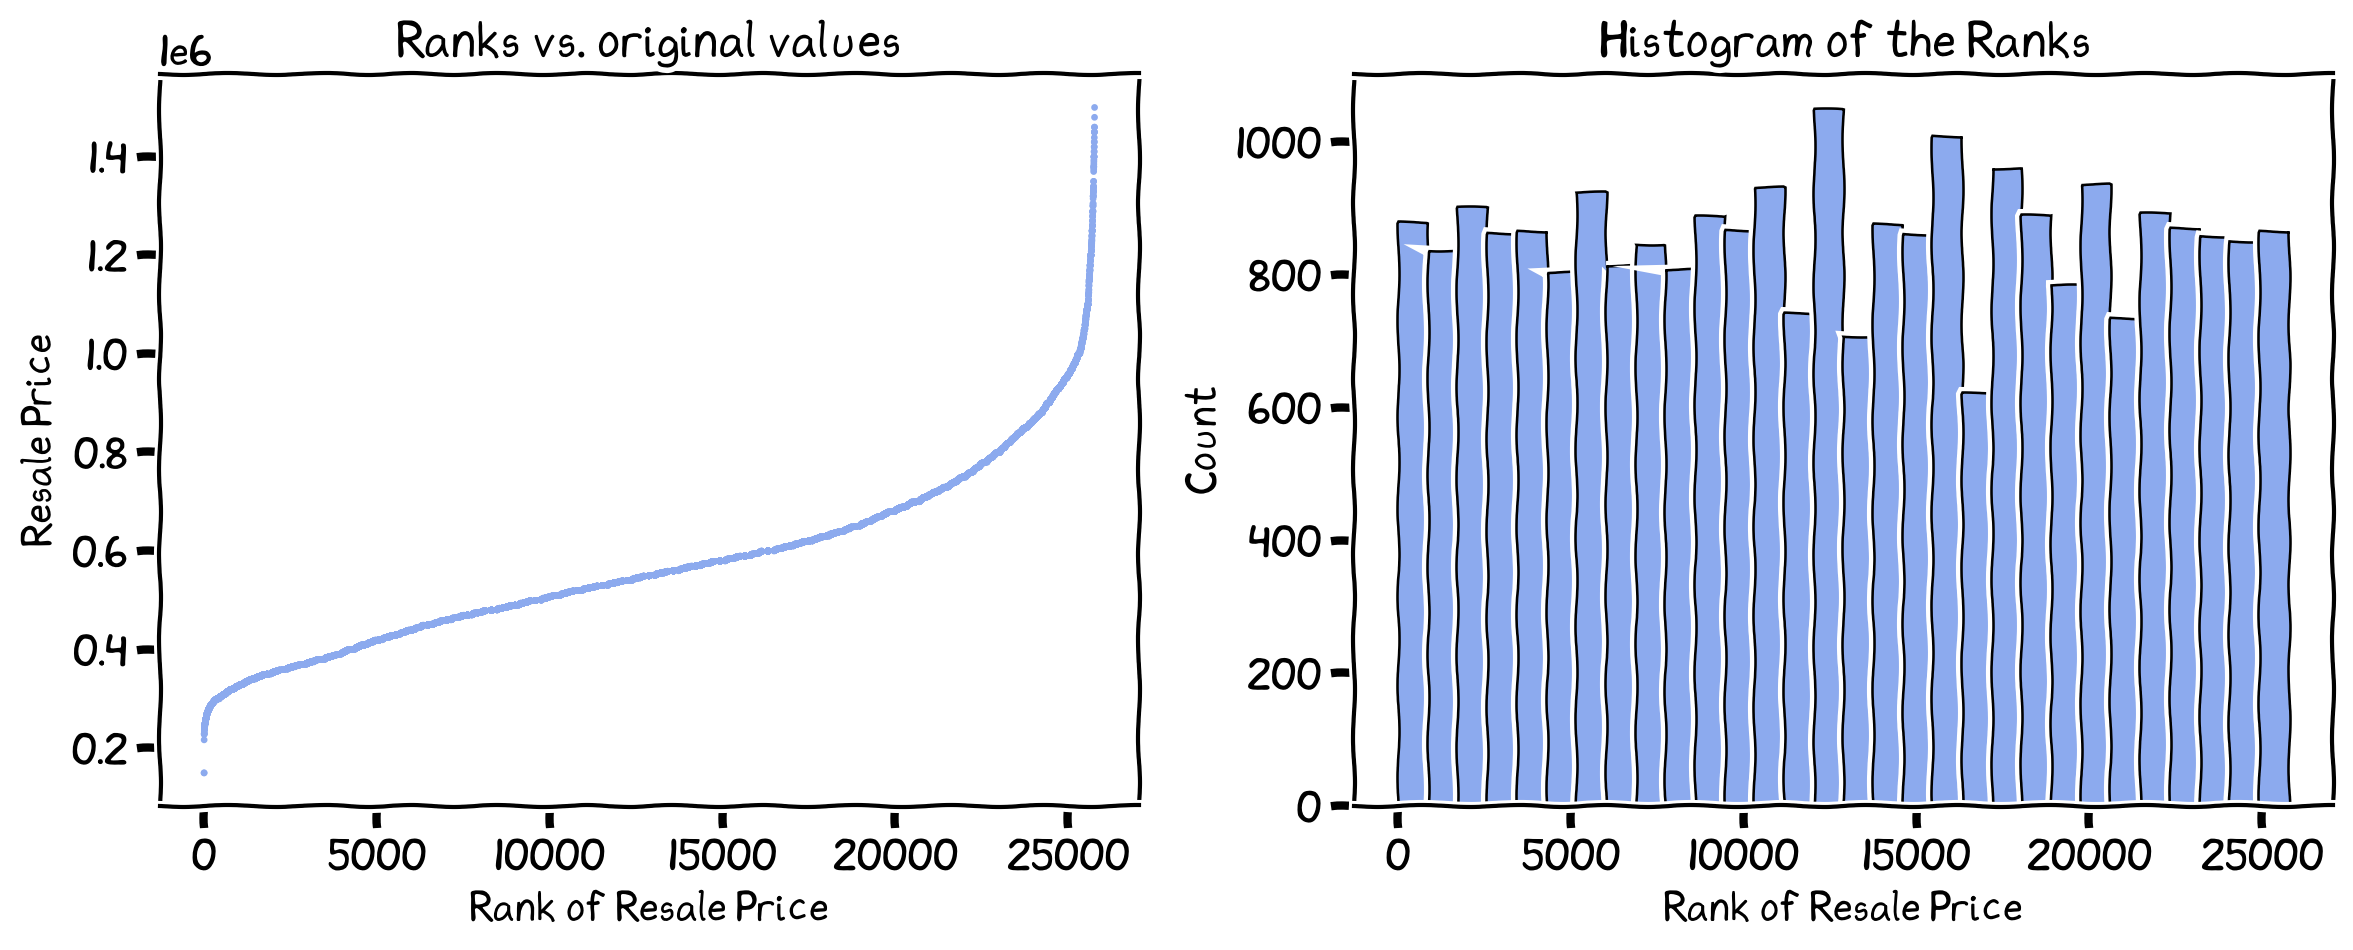
The relationship between the ranks and the original data, and the frequency distribution of the ranks.
What is the expected frequency distribution? Why is it not exactly the same as the expected distribution?
Advantages
Simplifies data interpretation by focusing on relative positions.
Can mitigate the impact of outliers.
Suitable for non-parametric statistical tests.
Disadvantages
Loses information about the original magnitude, scale, and internal variation of data.
Sensitive to ties in data, especially when using certain ranking methods.
May not be appropriate for all types of statistical analyses or machine learning algorithms.
Other Techniques
Sigmoid function,
Yeo-Johnson transformation,
etc.
Choosing the Right Technique
A simple guide
Assess data quality and characteristics: Examine your dataset for issues like missing values, outliers, non-linearity, and non-normal distributions. Identifying these challenges will inform the choice of transformation technique.
Understand variable types: Determine whether your variables are categorical or numerical. This will help you choose appropriate transformation methods, as some techniques are designed specifically for certain variable types.
Evaluate the goals of your analysis: Consider the objectives of your data analysis and the specific requirements of your chosen modeling technique. Different transformations can address particular challenges or better align with specific analysis goals.
Investigate common transformation techniques: Explore various methods like logarithmic, square root, Box-Cox, or Z-score (standardization) transformations for numerical data, and one-hot encoding or ordinal encoding for categorical data.
Compare the pros and cons: Weight the advantages and disadvantages of different techniques, considering factors like interpretability, ease of implementation, and potential impact on model performance.
Iterate and validate: Test multiple transformation techniques and evaluate their effects on your data and model performance. This will help you identify the most effective approach for your specific situation.
Consult resources and domain experts (expert in GIS): Leverage the knowledge of experienced professionals, peer-reviewed literature, and other credible sources to inform your decision-making process.