Definition of Numerical Data Classification
Numerical Data Classification is a method of categorizing or grouping numerical data into different classes or bins based on specific criteria or algorithms. This approach helps simplify data analysis, visualization, and interpretation by transforming continuous numerical values into discrete categories or intervals.
The number of breaks:
for visualization purpose, the common preferred number of breaks is ,
common numbers of breaks in practice is: 4--5,
follow the requirement of the analysis method or domain knowledge.
Several common classification methods include:
Equal Interval
Quantile Breaks
Standard Deviation
Natural Breaks
Head-tail Breaks
Data Classification Approaches
Equal Interval
This classification method involves dividing the range of the data into equal-sized intervals or classes. The class boundaries are determined by dividing the difference between the maximum and minimum values by the number of desired classes. This method is simple and easy to understand but may result in classes with significantly different numbers of observations or misrepresentation of the data distribution.
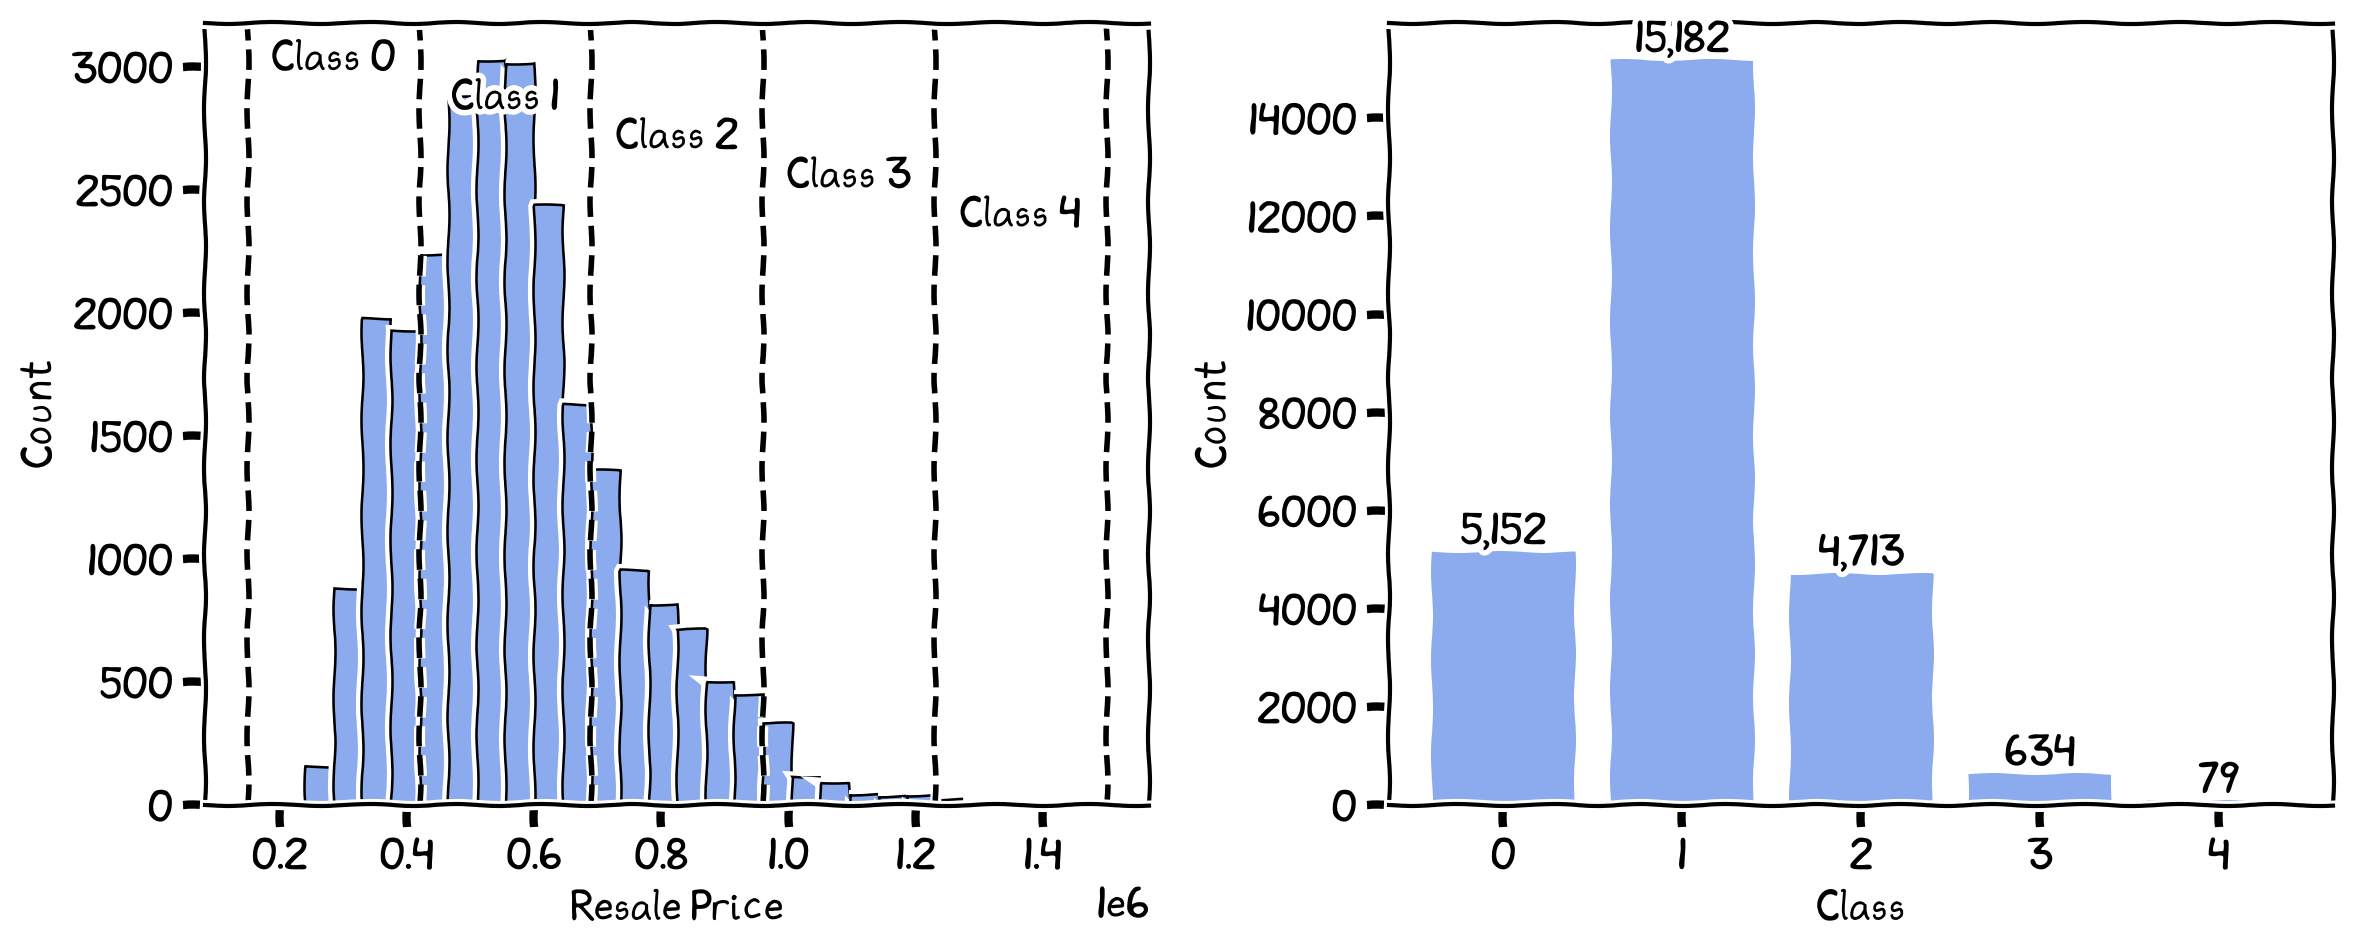
The breaks and the number of records in each class for Equal Interval.
Quantile Breaks
Quantile classification is based on the statistical distribution of the data, dividing the data into classes with an equal number of observations. Each class represents a quantile, such as quartiles (4 classes), quintiles (5 classes), deciles (10 classes), or other user-specified quantiles. This method ensures that each class has an equal frequency of values.
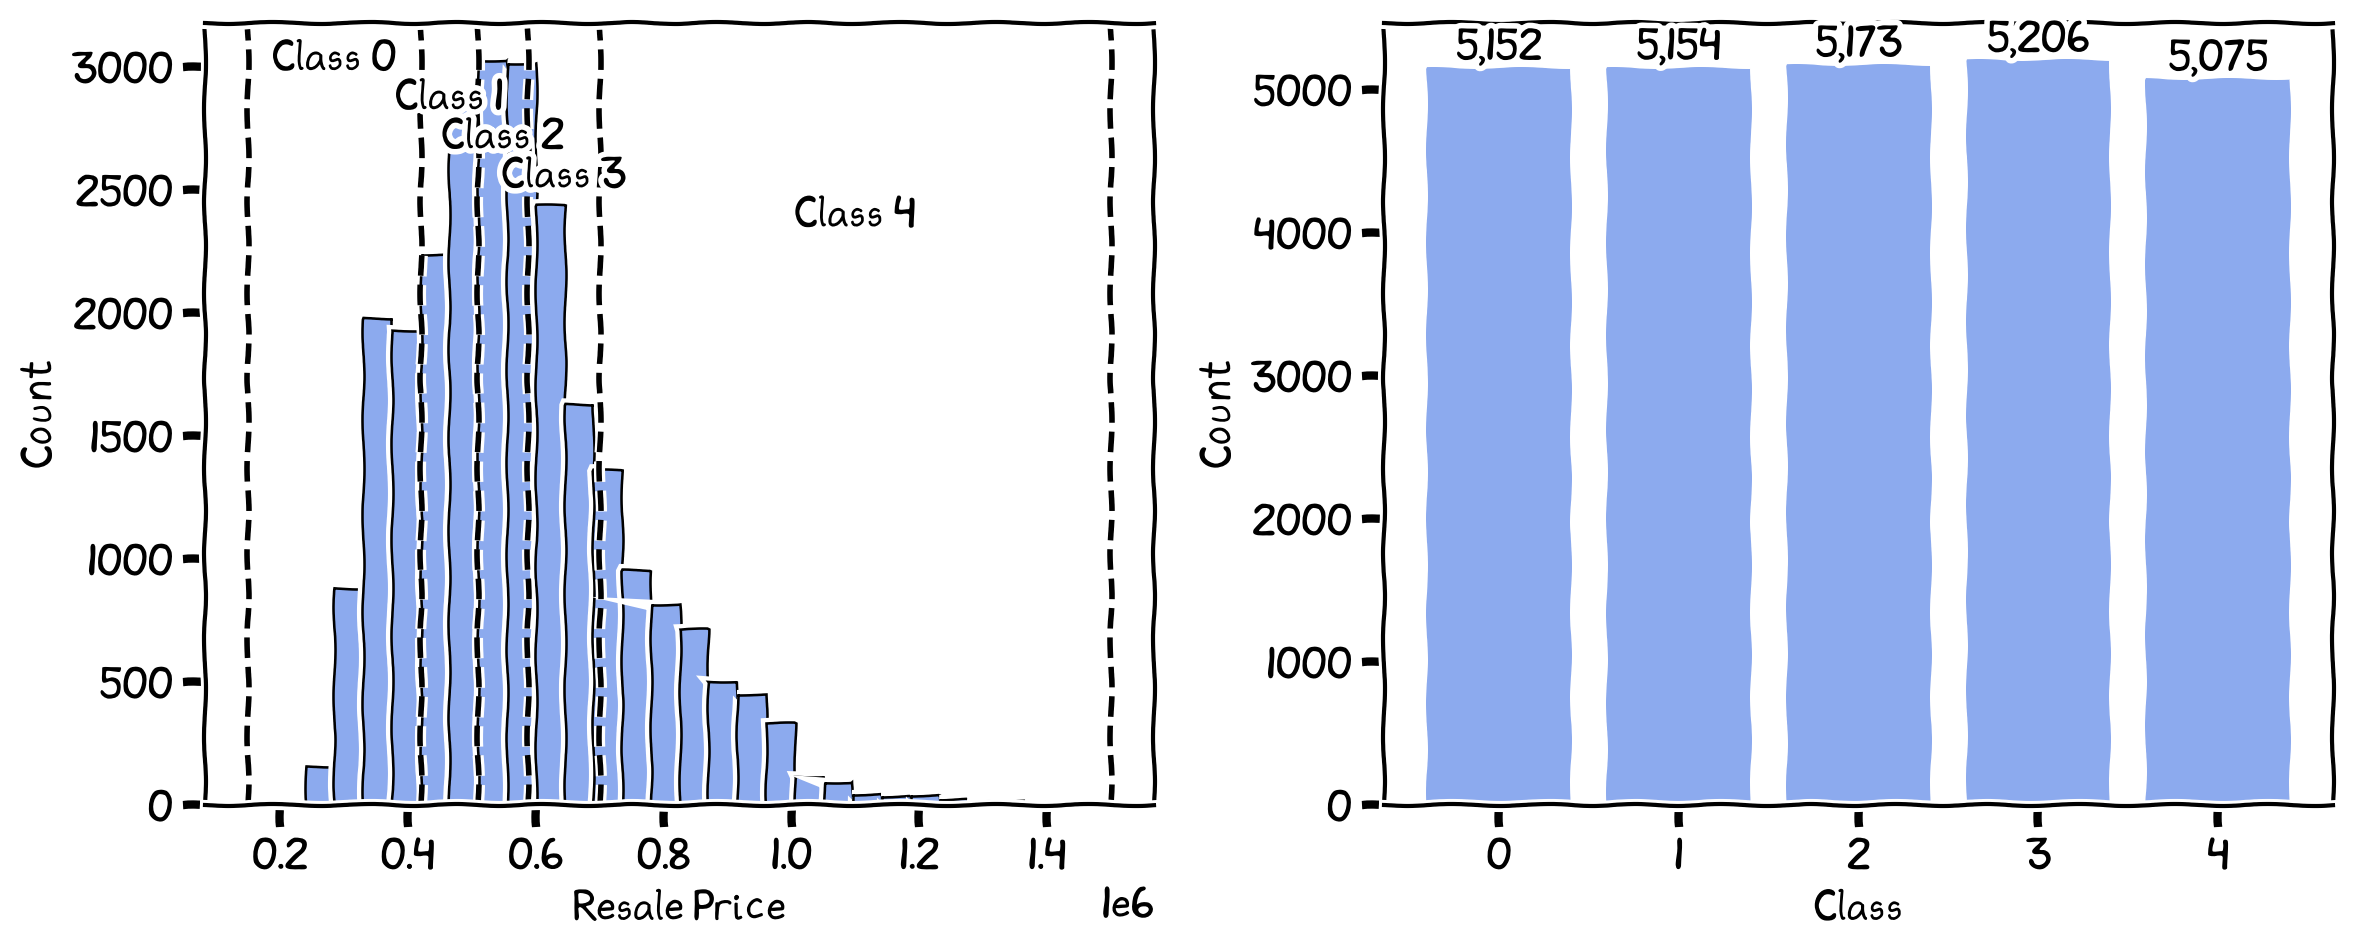
The breaks and the number of records in each class for Quantiles.
Standard Deviation
Standard Deviation classification divides the data into classes based on the number of standard deviations from the mean. This method is helpful for data that follow a normal or near-normal distribution, as it takes into account the dispersion and variability of the data.
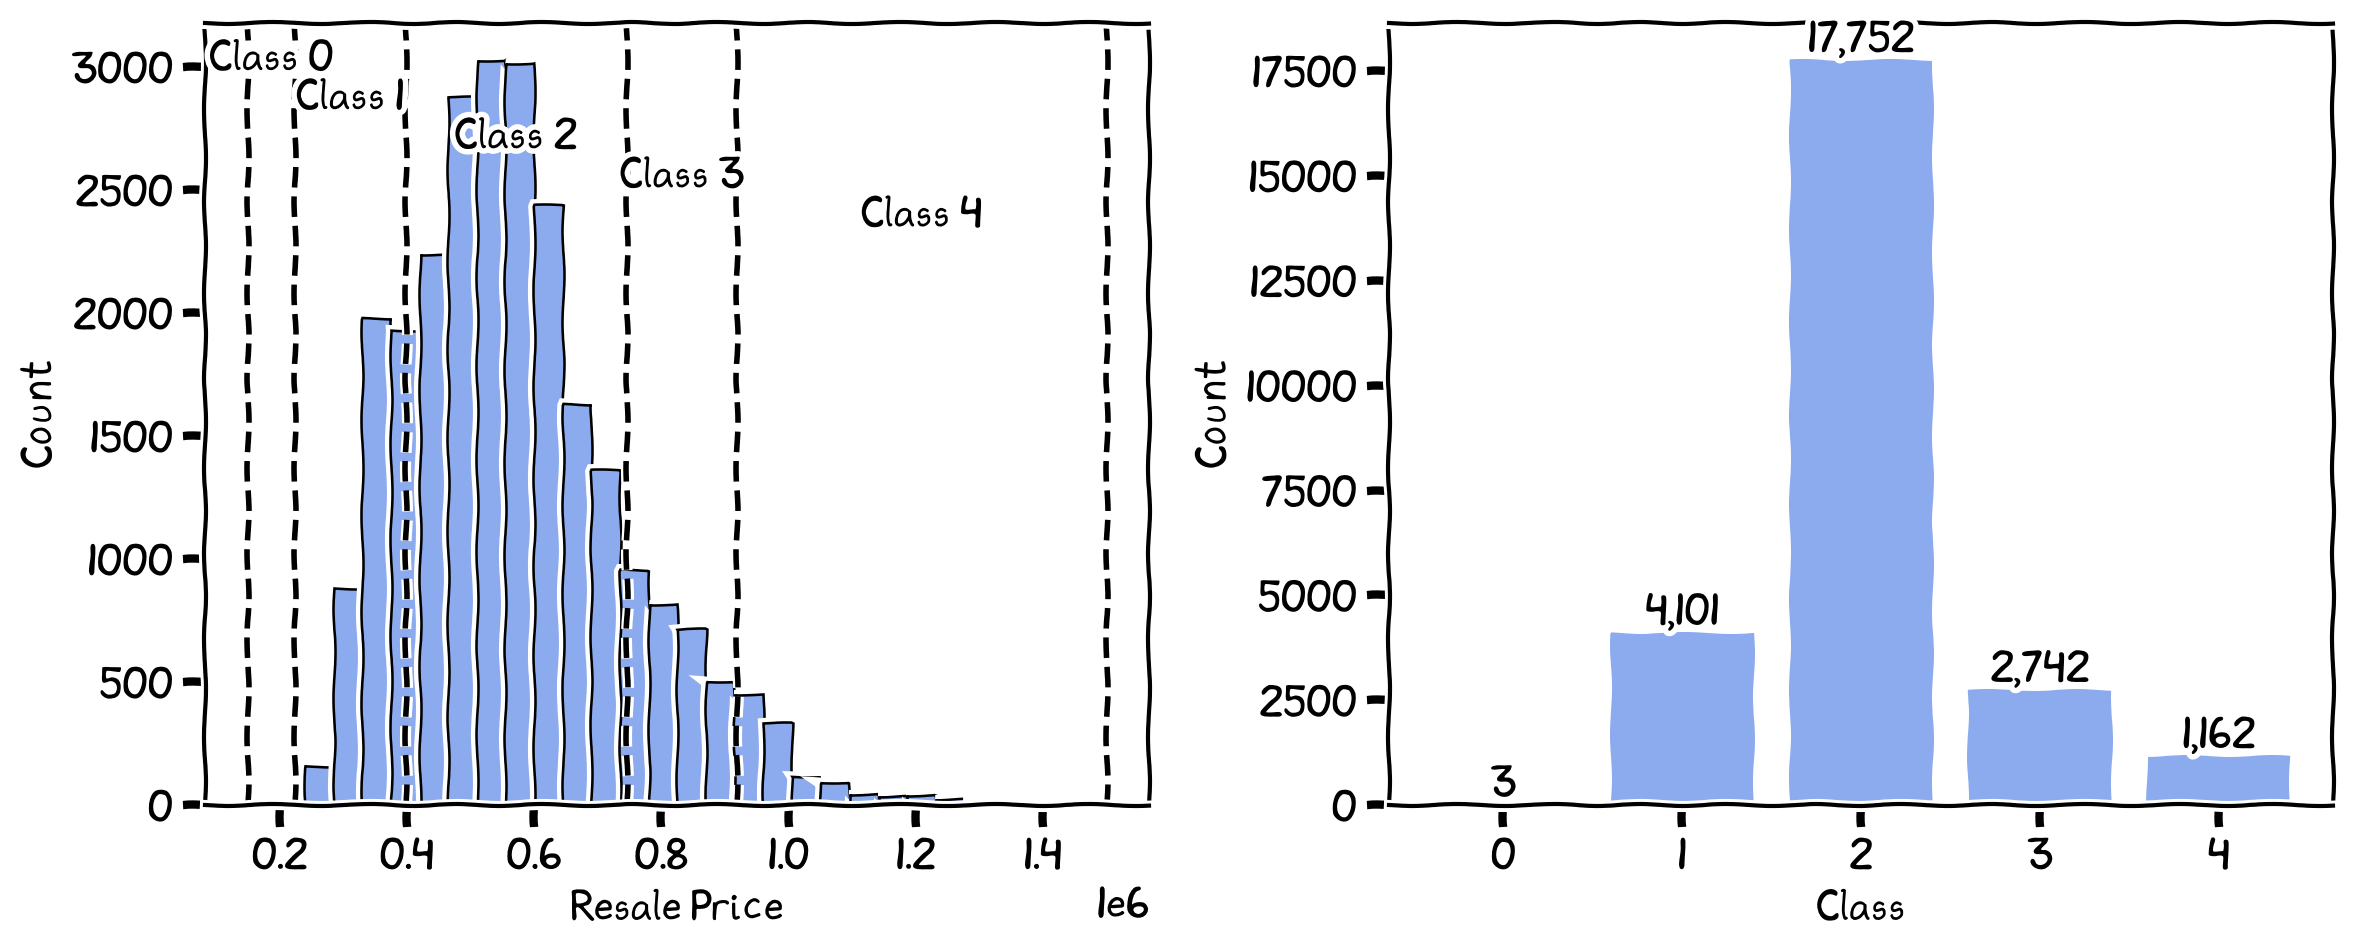
The breaks and the number of records in each class for standard deviation.
Natural Breaks
Natural Breaks classification is a data-driven method that seeks to minimize the within-class variance and maximize the between-class variance. It identifies break points or class boundaries by grouping similar values together while keeping dissimilar values in different classes. This method is widely used in geographic information systems (GIS) and spatial data analysis.
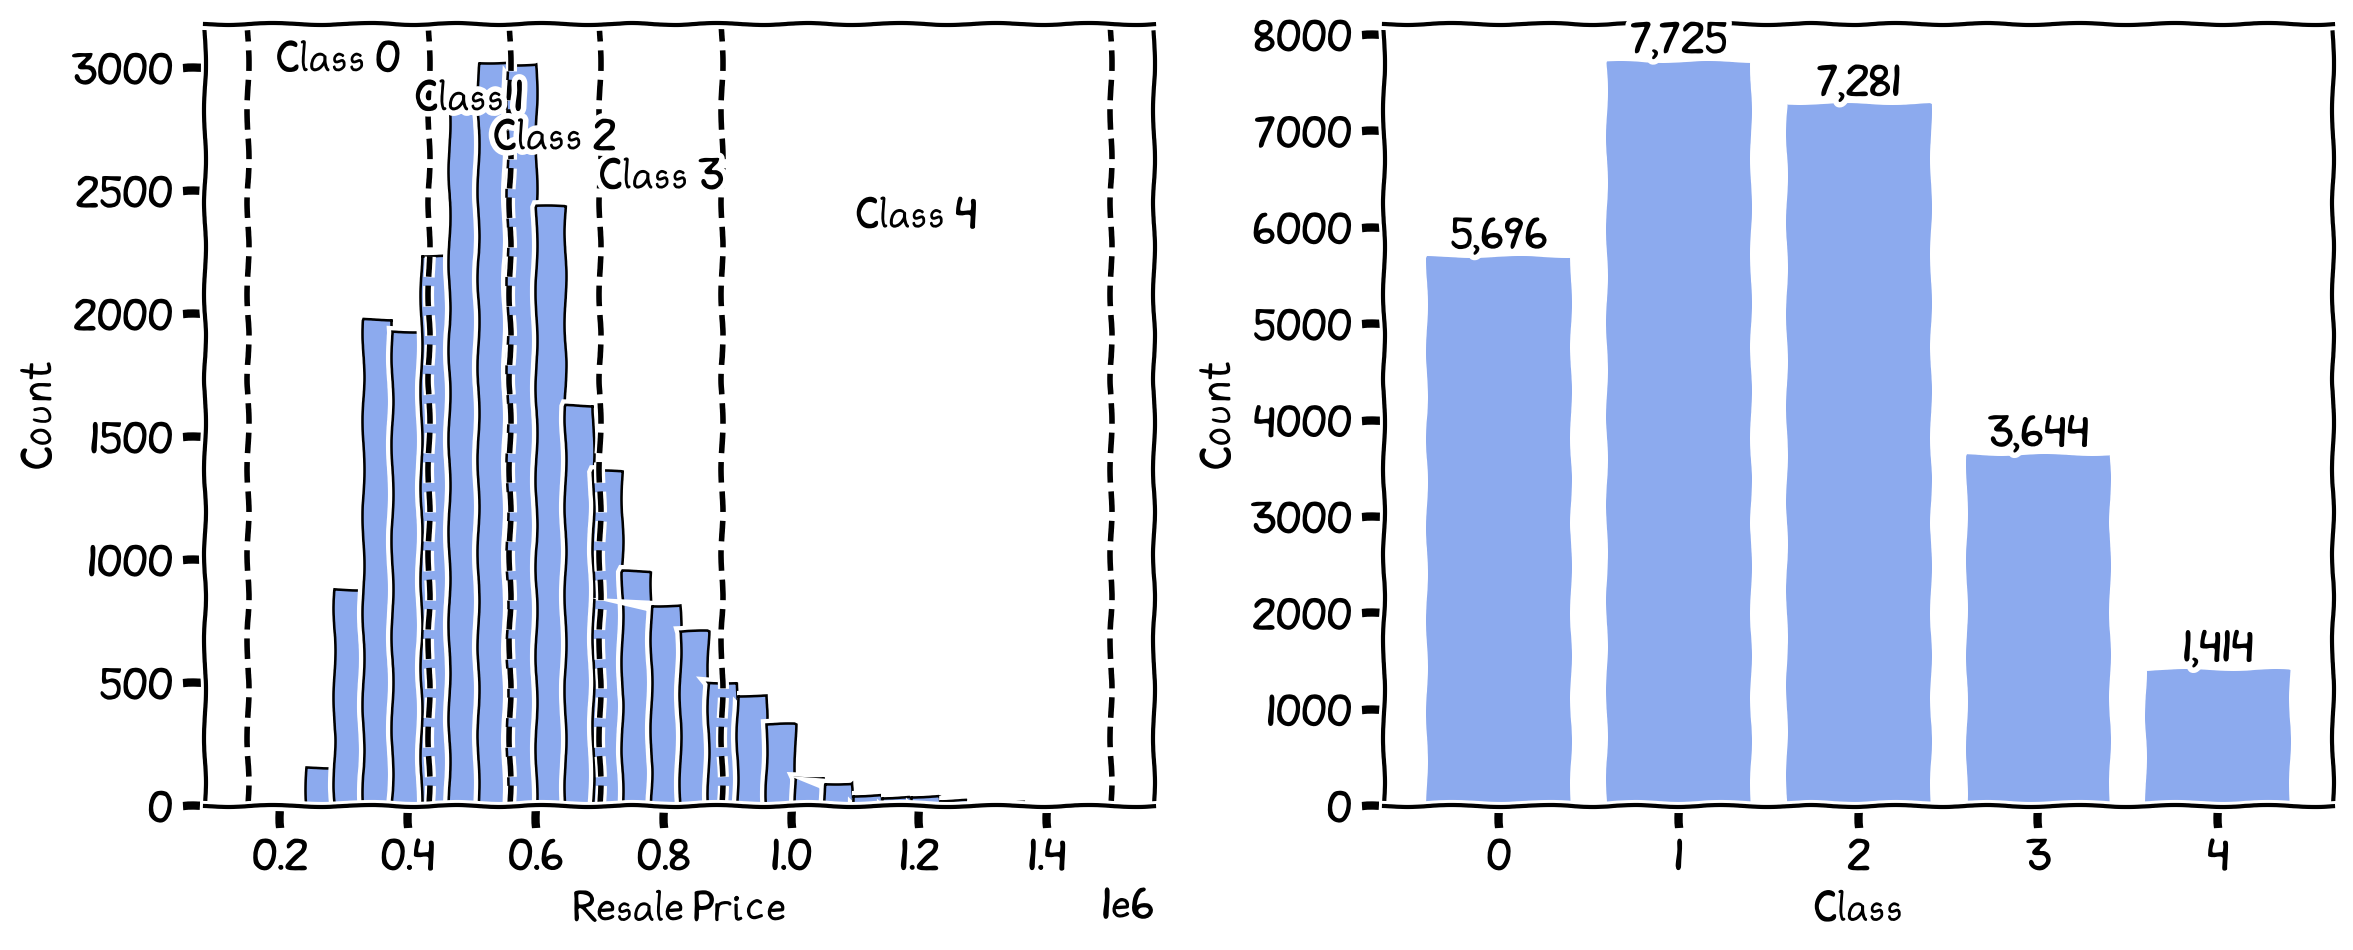
The breaks and the number of records in each class for Natural Breaks.
Head-tail Breaks
Head/Tail Breaks is a data classification method introduced to categorize data with heavy-tailed distributions. This method offers an alternative to traditional classification schemes by focusing on the inherent hierarchy within the data. The Head/Tail Breaks method uses the mean or average to divide a dataset into small and large values recursively. It starts by calculating the first mean (m1) of the entire dataset and then calculates the second mean (m2) for values greater than m1. This process continues until the notion of “far more small things than large ones” no longer holds.
See Head/Tail Breaks: A New Classification Scheme for Data with a Heavy-Tailed Distribution for more details.

The breaks and the number of records in each class for Head/Tail Breaks.
Summary
Choosing an optimal data classification scheme is essential for effectively summarizing and analyzing numerical data. The selection depends on the data’s characteristics, the analysis objectives, and the desired level of detail. See a list here from mapclassify for many other approaches. Experiment with different methods and assess their effectiveness in achieving your analytical goals. The optimal scheme should provide meaningful distinctions between classes, maintain simplicity, and facilitate accurate data interpretation.
While Natural Breaks is the default option in many GIS software, it is not always the most suitable option for the data. Sometime, manually breaking the data is also recommended.
Equal Interval: This simple method divides the data range into equal-sized intervals. It is straightforward and easy to understand but may result in classes with significantly different numbers of observations.
Quantile Breaks: This method divides data into classes with an equal number of observations based on statistical distribution. It is useful when you require a specific number of classes or a balanced representation of the data.
Standard Deviation: This method classifies data based on the number of standard deviations from the mean. It is helpful when data follows a normal or near-normal distribution and accounts for data dispersion and variability.
Natural Breaks: This data-driven method minimizes within-class variance and maximizes between-class variance. It is widely used in geographic information systems (GIS) and spatial data analysis. Jenks’ natural breaks are suitable for datasets with uneven distributions or when you need to emphasize the differences between groups.
Head/Tail Breaks: Introduced by Jiang (2013), this recursive method focuses on capturing the inherent hierarchy within heavy-tailed data. It provides an alternative to traditional schemes and is particularly suitable for data with a heavy-tailed distribution.
- Jiang, B. (2013). Head/Tail Breaks: A New Classification Scheme for Data with a Heavy-Tailed Distribution. The Professional Geographer, 65(3), 482–494. 10.1080/00330124.2012.700499