What is Analysis of Variance
Definition: Analysis of Variance, aka ANOVA, is a statistical method used to compare the means of more than two groups to determine whether there is a significant difference between them.
The primary purpose of ANOVA is to test the hypothesis that the means of several populations are equal. It helps determine whether any observed differences between group means are real or occurred by chance.
When to use ANOVA: ANOVA is used when comparing more than two group means. It is particularly useful in experimental settings where a single factor (independent variable, one-way ANOVA) is manipulated at multiple levels (e.g., low, medium, high), and the researcher wants to investigate the effect of this manipulation on the outcome (dependent variable).
Assumptions of ANOVA
ANOVA is based on the following assumptions:
Numeric Response: The target (dependent) variable should be continuous, either ratio or interval.
Normality: The data within each group should be approximately normally distributed.
Equal Variances (homoscedasticity): The variances of the populations being compared should be roughly equal.
Independence: Observations should be independent of each other. This means that the data from one subject should not influence the data from another subject.
Categorical treatment or factor variables: ANOVA evaluates mean differences between one or more categorical variables (such as treatment groups), which are referred to as factors or “ways.”
Note: It is essential to verify that these assumptions are met before conducting ANOVA. If assumptions are not satisfied, the validity of the F-test may be compromised. In such cases, alternative methods such as repeated measure ANOVA, Welch’s ANOVA, non-parametric tests or more robust techniques may be considered.
Steps of ANOVA
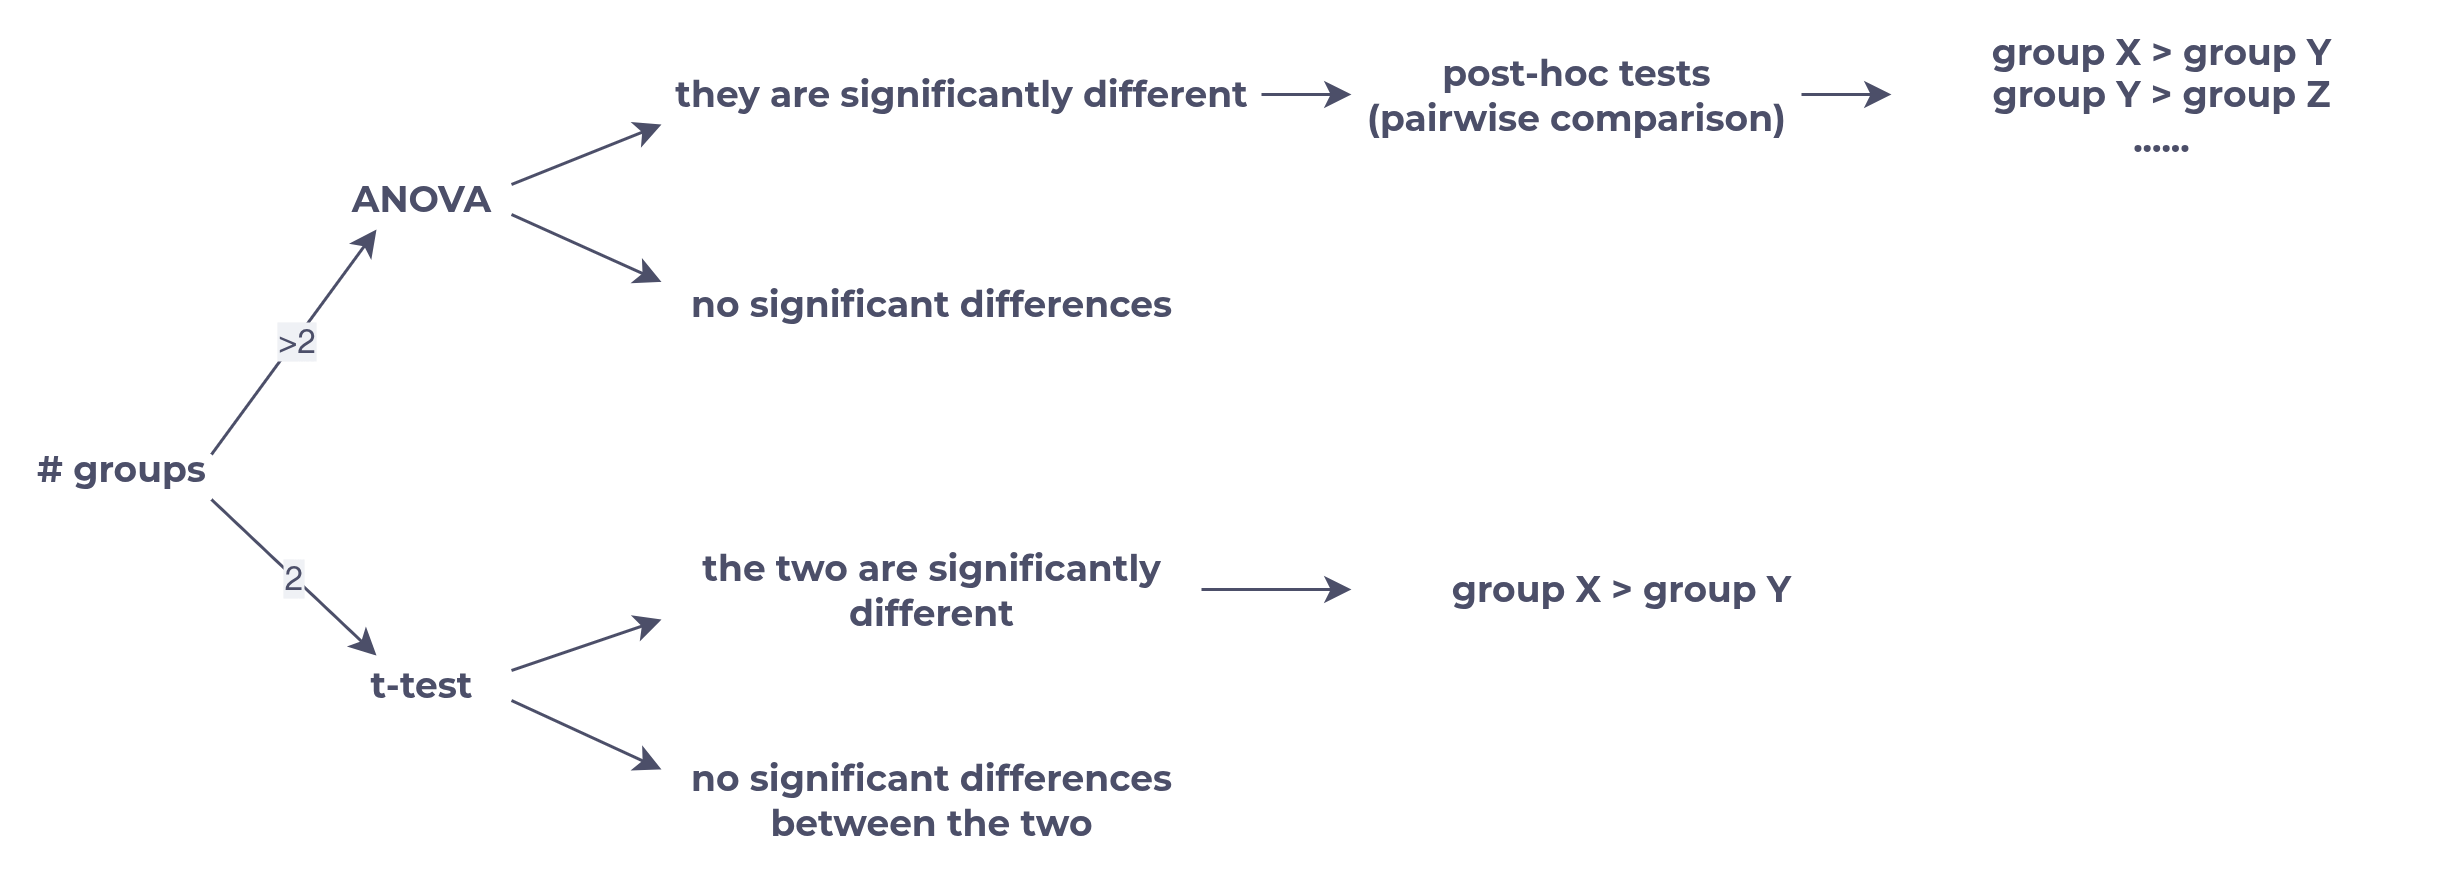
The analysis process for t-test, ANOVA, and post-hoc test.
Types of ANOVA
Here only some commonly used types are introduced. Other types, e.g,. two-ways, three-ways, nested, Welch’s ANOVA... are not covered here since those data is less common, and the concept is similar (anyway).
One-way ANOVA
between groups
the simplest and straighforward situation
Repeated Measures ANOVA
within group
when the groups are not independent
Mixed-Design ANOVA
when both between and within occurs
One-way ANOVA
Concept One-way ANOVA is a statistical technique used to compare the target variable’s means of three or more independent groups with a single independent variable (or factor). It helps determine whether any observed differences between group means are real or occurred by chance.
Example To compare the average test scores of students who received different teaching methods.
Hypothesis Tested in One-way ANOVA
: The population means of the groups being compared are equal. Symbolically: , where μ_i represents the mean of the ith group, and k is the total number of groups.
: At least one of the group means is different from the others.
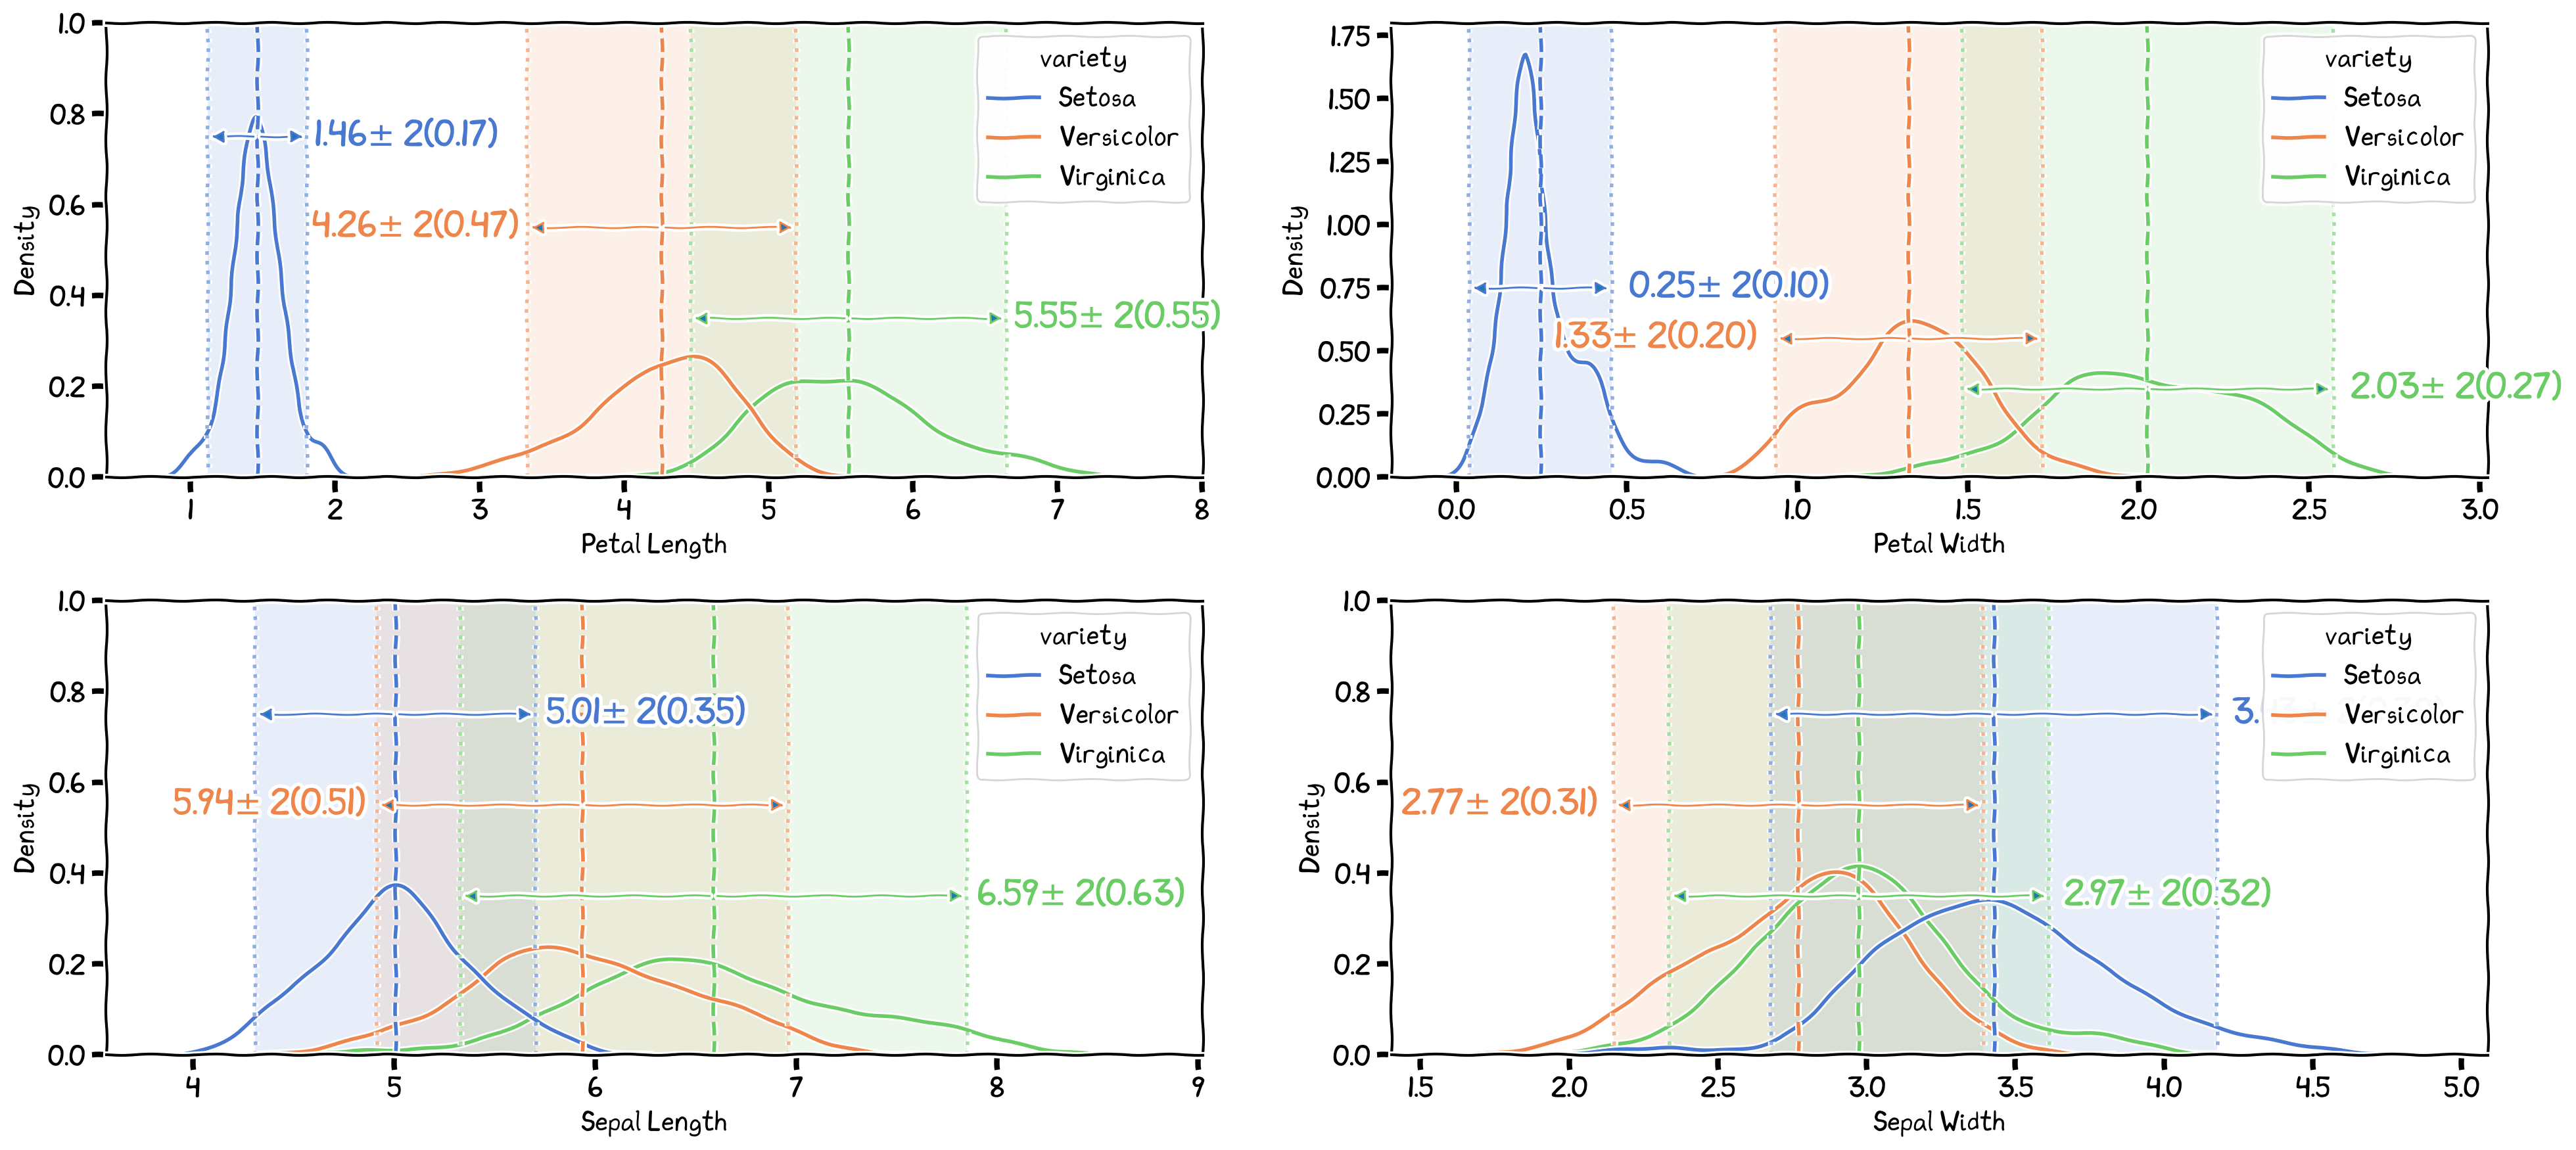
The One-way ANOVA comparing the four target variables between the three species.
Table 1:The ANOVA result for the four target variables. Each row display the result from a single ANOVA. All were significant.
| variety | ddof1 | ddof2 | F | p-unc | np2 |
|---|---|---|---|---|---|
| petal.length | 2 | 147 | 1180.16 | 0.000 | 0.941 |
| petal.width | 2 | 147 | 960.007 | 0.000 | 0.929 |
| sepal.length | 2 | 147 | 119.265 | 0.000 | 0.619 |
| sepal.width | 2 | 147 | 49.16 | 0.000 | 0.401 |
Repeated Measures ANOVA
Concept Repeated measures ANOVA, also known as within-subjects ANOVA, is a statistical technique used to compare means of three or more dependent groups when the same subjects are observed under various conditions or at different points in time.
Example To compare the reaction times of a group of participants before, during, and after receiving a treatment.
Hypothesis Tested in Repeated Measures ANOVA
: The population means of the different conditions or time points are equal. Symbolically: , where μi represents the mean of the ith condition or time point, and k is the total number of conditions or time points.
: At least one of the population means is different from the others. Symbolically: There exists at least one i and j such that .
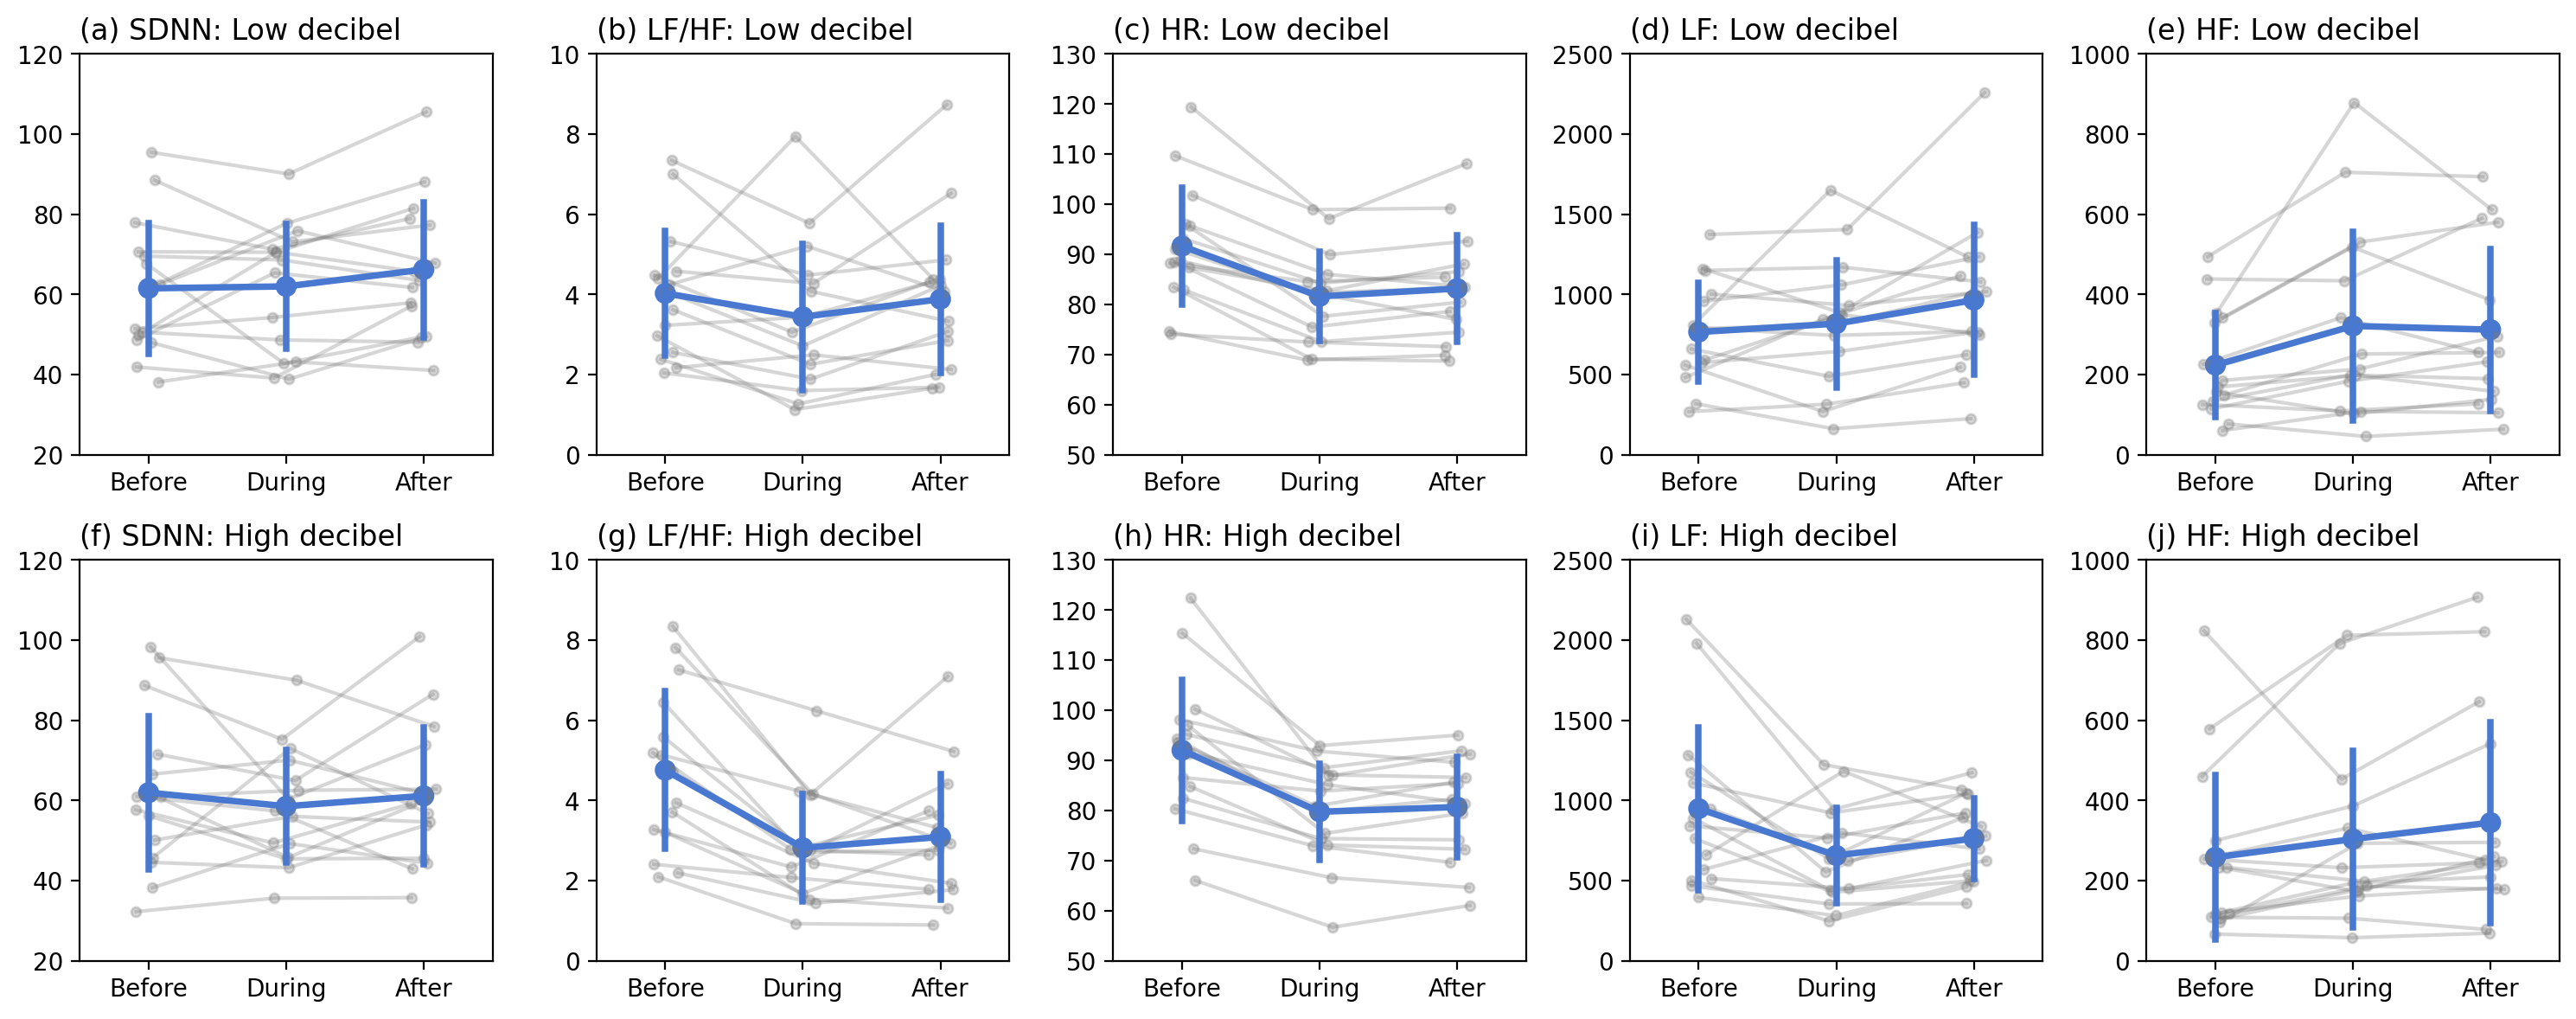
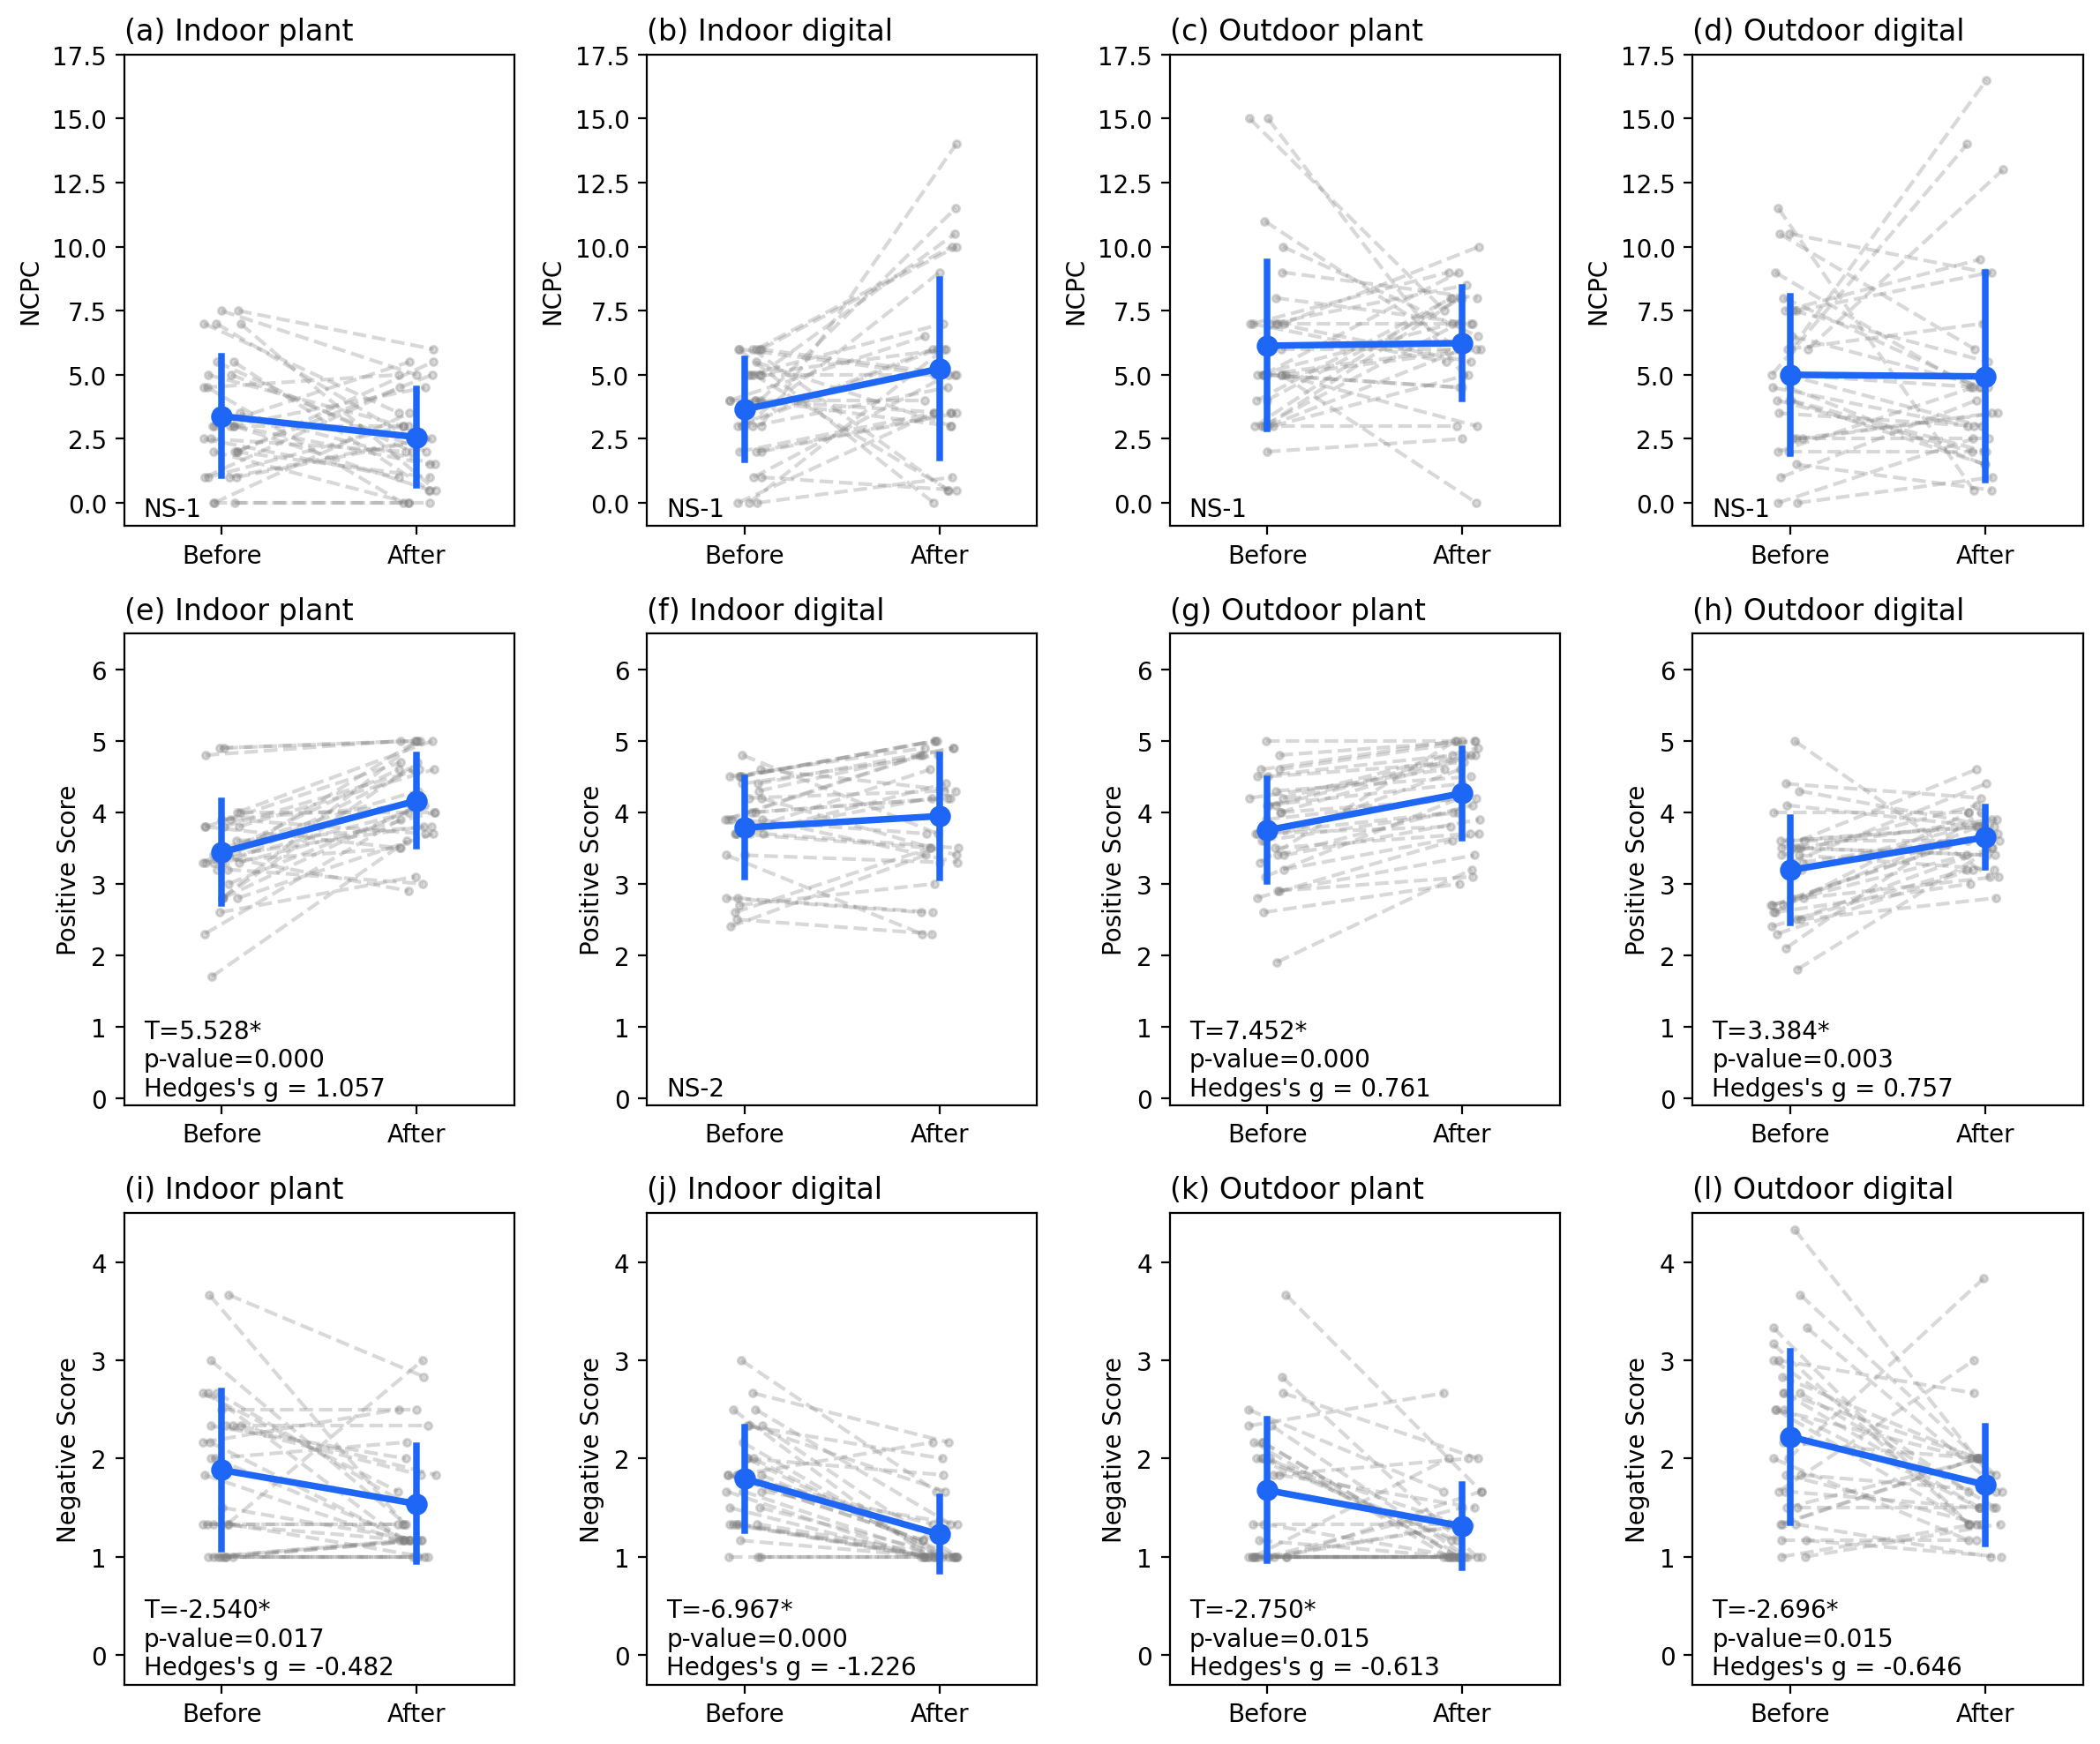
The physiological responses before, during and after two types of VR treatments.
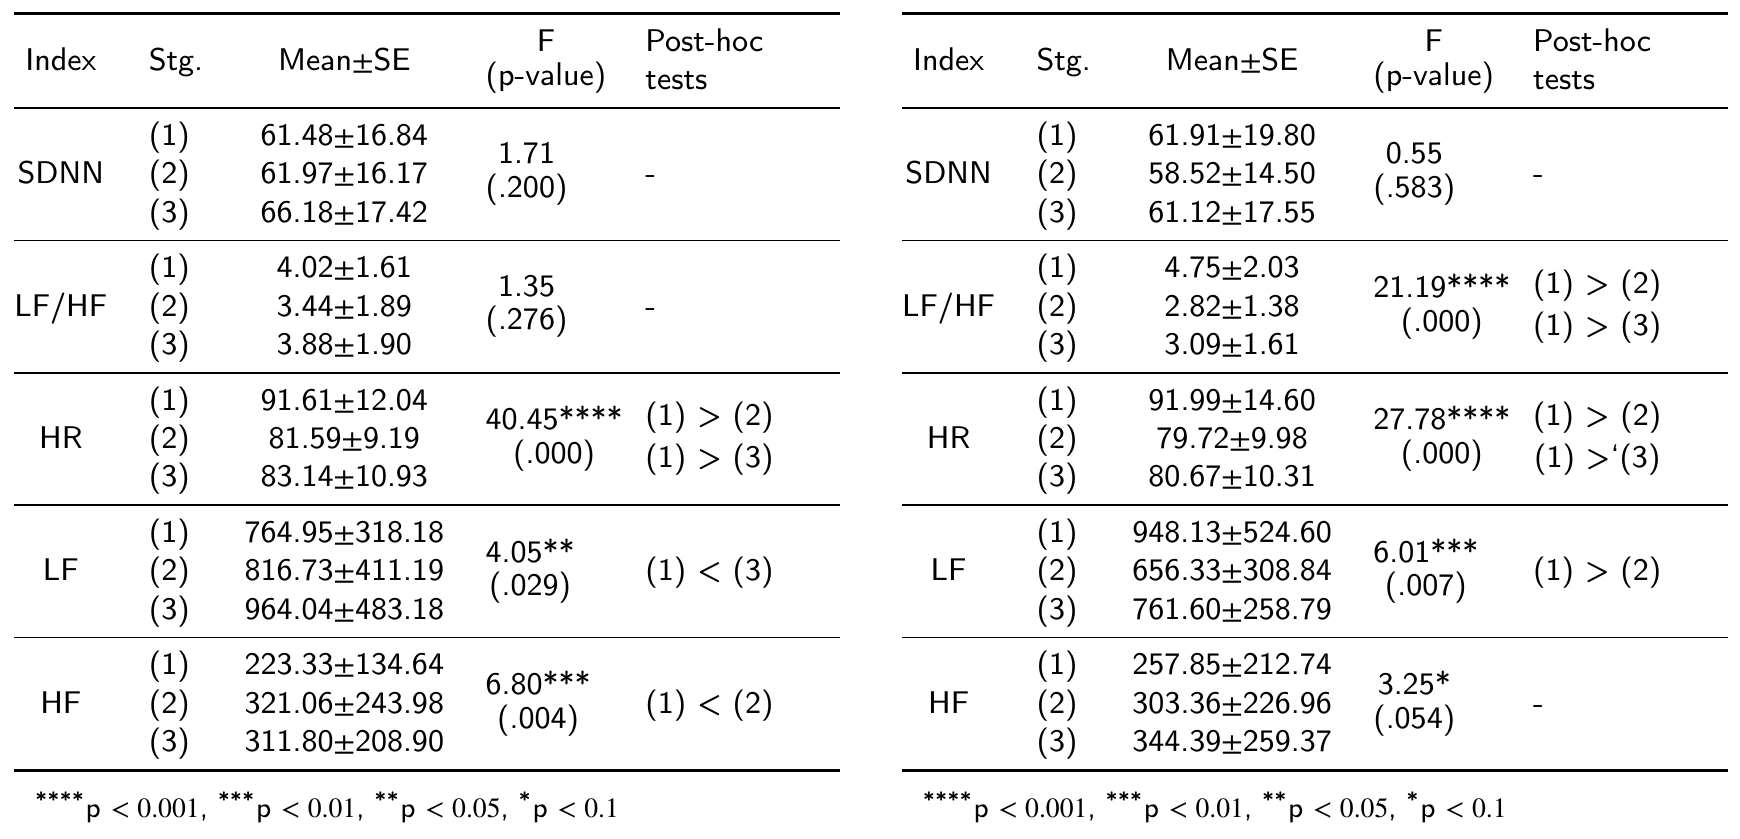
The tables about the repeated measures and post-hoc results: (left) low decibel, (right) high decibel.
Mixed-Design ANOVA
Concept Mixed-design ANOVA, also known as split-plot ANOVA, is a statistical method used for analyzing data from studies with both between-subjects factors and within-subjects factors. It combines features of one-way ANOVA and repeated measures ANOVA, allowing researchers to examine the effects of multiple independent variables on a dependent variable.
Key Points
Between-subjects factors involve comparisons between different groups of participants, similar to one-way ANOVA.
Within-subjects factors involve comparisons within the same group of participants at different time points or under various conditions, similar to repeated measures ANOVA.
Mixed-design ANOVA enables researchers to assess the main effects of each factor and the potential interaction effects between factors.
Assumptions The assumptions of mixed-design ANOVA are similar to those of one-way and repeated measures ANOVA, including normality, homogeneity of variances, and independence. Additionally, the assumption of sphericity must be met for the within-subjects factor.
Use case By using mixed-design ANOVA, researchers can gain a deeper understanding of the complex relationships between multiple factors and their effects on the dependent variable. It’s a powerful tool for analyzing data from various experimental designs, particularly in fields such as psychology, medicine, and education.
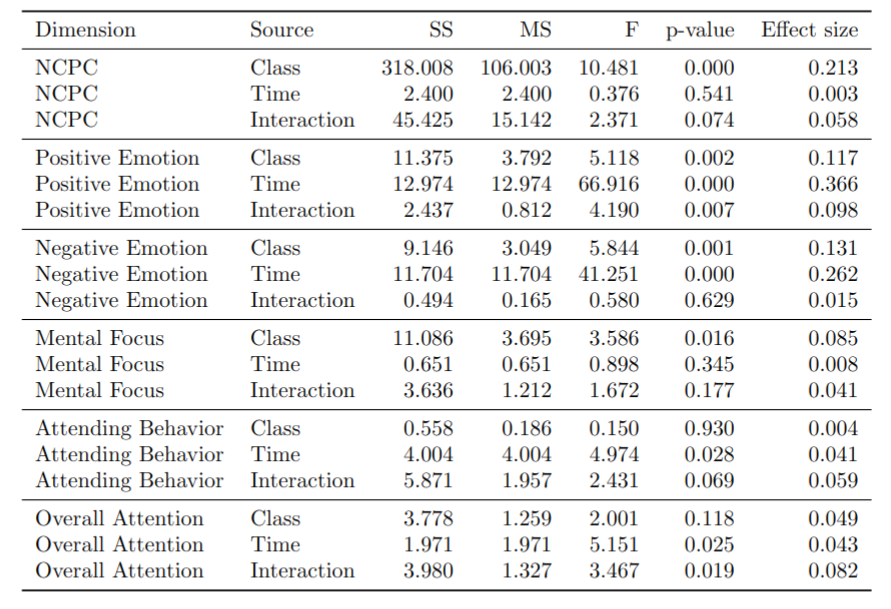
The mixed ANOVA result between classes, time (pre-test vs. post-test), and the interaction between class and time.
The post-hoc test after mixed ANOVA, to observe the time effects in different condition.
F-test, F-distribution, and F-statistic
The F-test is a statistical test used in ANOVA to compare variances and determine whether there is a significant difference between group means. The F-statistic (or F-ratio) is calculated as the ratio of the between-group variance to the within-group variance:
The F-statistic reflects the extent to which the variation between groups exceeds the variation within groups. A higher F-value indicates a greater difference between group means relative to the variability within each group.
Under the null hypothesis that all group means are equal, the F-statistic follows an F-distribution, which is a family of continuous probability distributions characterized by two parameters: degrees of freedom for the numerator () and degrees of freedom for the denominator ().
The F-distribution is used to determine the critical F-value for a given significance level () and degrees of freedom ( and ). This critical value is compared with the calculated F-statistic to make a decision about the null hypothesis.
Making decisions in ANOVA using the F-value
To make decisions in ANOVA, the calculated F-statistic is compared to the critical F-value obtained from the F-distribution.
If the F-statistic is larger than the critical F-value, we reject the null hypothesis, concluding that at least one group mean is significantly different from the others.
If the F-statistic is smaller than the critical F-value, we fail to reject the null hypothesis, concluding that there is insufficient evidence to claim a significant difference between group means.
In practice, a p-value is often computed and compared to a predetermined significance level () to make this decision. If the p-value is smaller than , the null hypothesis is rejected.
Post-hoc Tests
Purpose of Post-hoc Tests
Post-hoc tests are follow-up analyses conducted after a significant overall F-test in ANOVA. Their purpose is to determine which specific group means are significantly different from one another. Since ANOVA only tells us that at least two means are different, post-hoc tests help pinpoint where those differences lie.
Common post-hoc tests
Tukey’s HSD Test:
Simultaneously compares all possible pairs of means.
Controls the family-wise error rate, ensuring the overall probability of making at least one Type I error across all comparisons remains at the desired significance level.
Generally more appropriate when making multiple comparisons in an ANOVA context, as it has greater power to detect significant differences while controlling for multiple comparisons.
Pairwise t-tests:
Compares two means at a time.
Performing multiple pairwise t-tests inflates the Type I error rate, as each test uses a fixed significance level (e.g., 0.05) without considering the number of comparisons made.
While adjustments such as the Bonferroni correction can control for multiple comparisons, using individual t-tests becomes less powerful and more complex as the number of comparisons increases.
Roadmap for choosing ANOVA and post-hoc tests
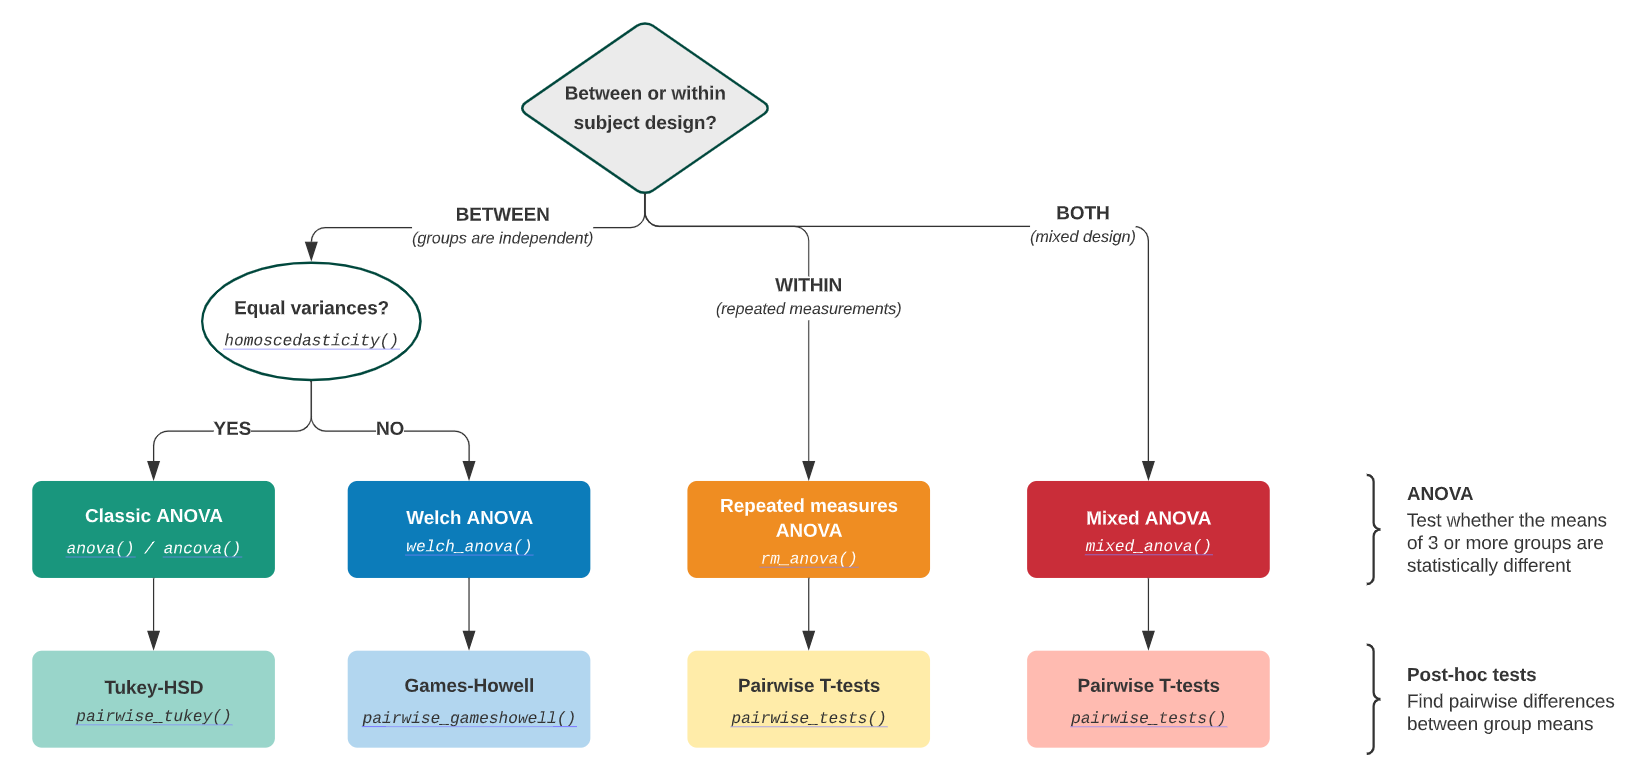
The roadmap for choosing ANOVA and post-hoc tests approaches. by Pingouin