Limitations of t-tests and ANOVA
Both t-test and ANOVA have assumptions of:
numerical responses (ratio or interval target variable)
normality (target variable)
independence (within and between groups)
equal variances
When these assumptions are violated, the validity of t-tests and ANOVA may be compromised, leading to inaccurate results.
In this case, the relevant non-parametric tests could be used.
Roadmap for choosing non-parametric tests
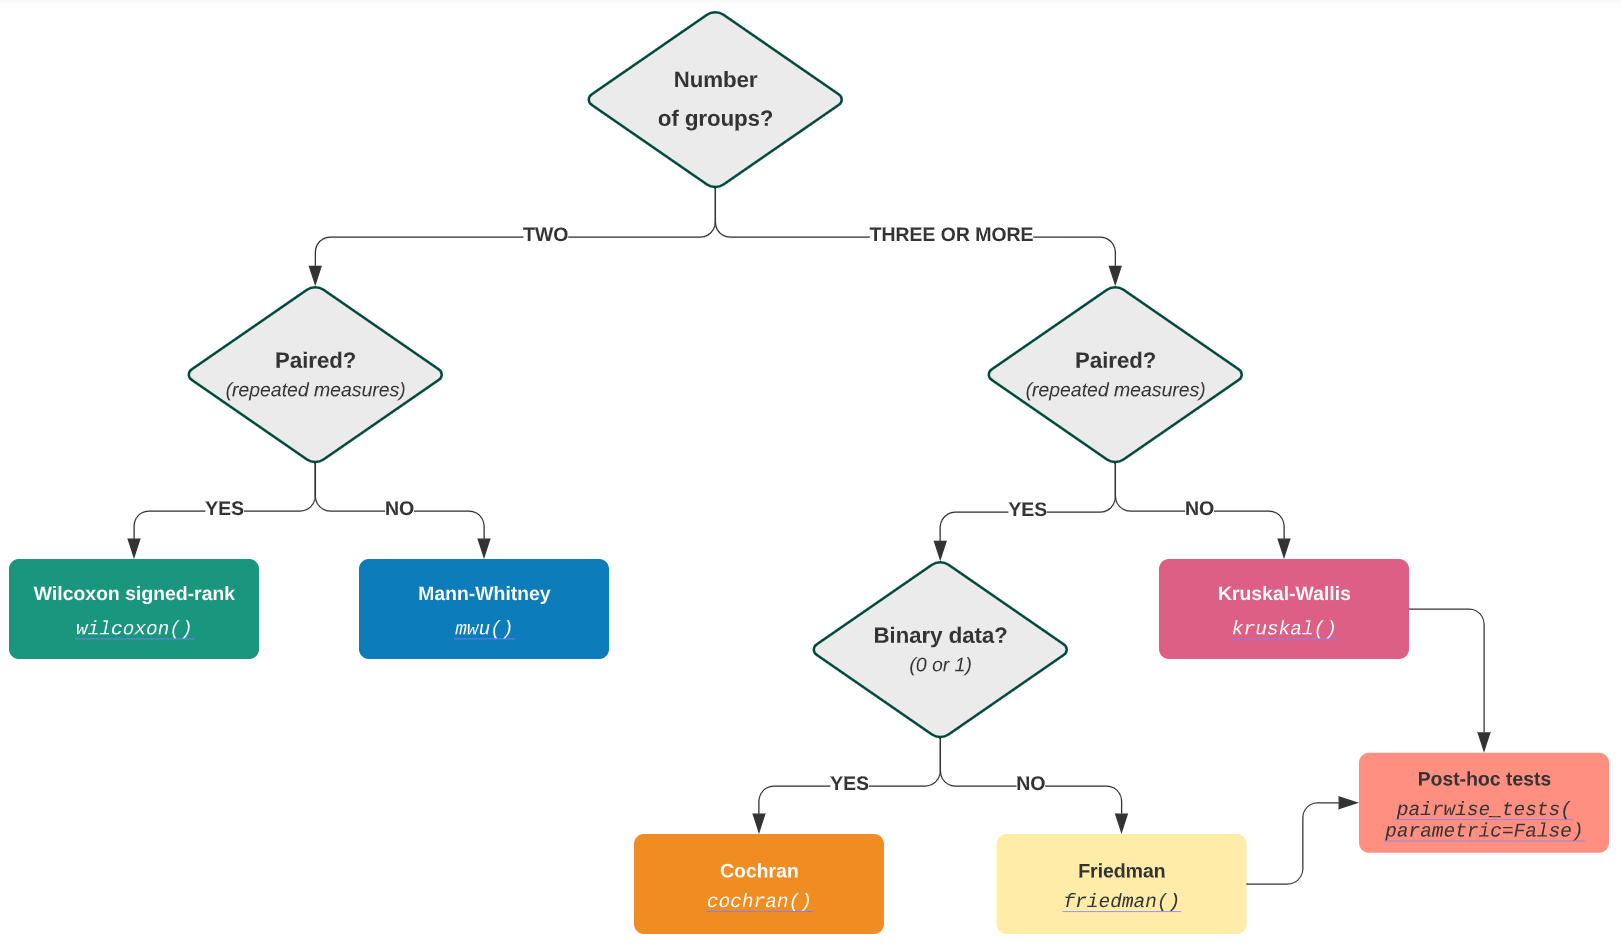
The roadmap for choosing non-parametric tests approaches. by Pingouin
The non-parametric alternatives
T-test
Independent samples t-test
Mann-Whitney U Test
Paired samples t-test
Wilcoxon Sign-Rank Test
ANOVA
One-way ANOVA
Kruskal-Wallis Test
Repeated Measures ANOVA
Friedman Test (non-binary data)
Cochran Test (binary data)
An example (socio-economic status in Brunei)
The income levels are ordinal (ranks) data, which is not numerical, and not normally distributed. Two groups are observed in both example, i.e., gender (male: 1, female: 0) and rural (rural: 1, urban: 0).
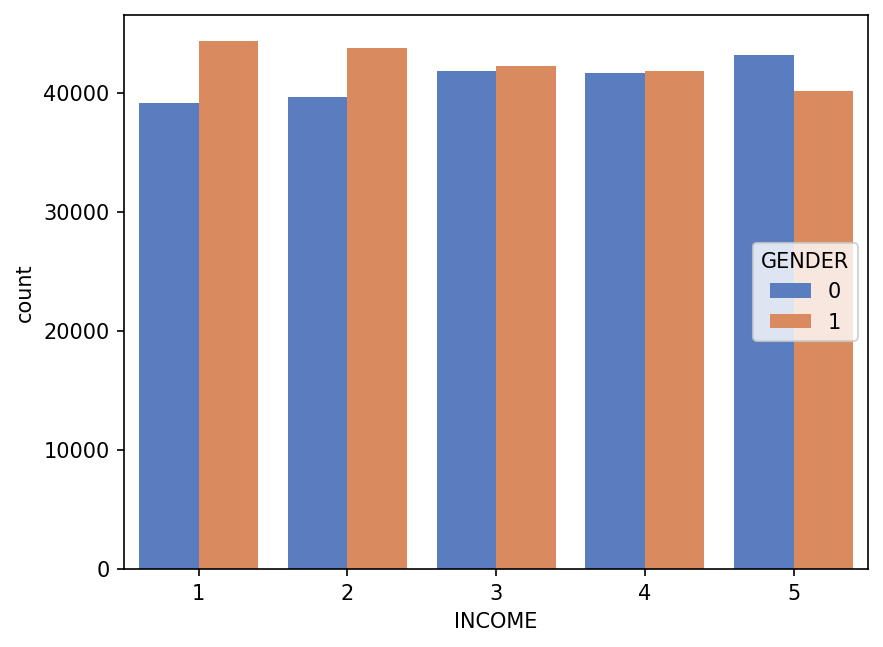
(a)by age
(b)by rural
Figure 2:Comparing the income level vs. gender (a) and rural/urban (b). Data source: A global dataset of 7 billion individuals with socio-economic characteristics
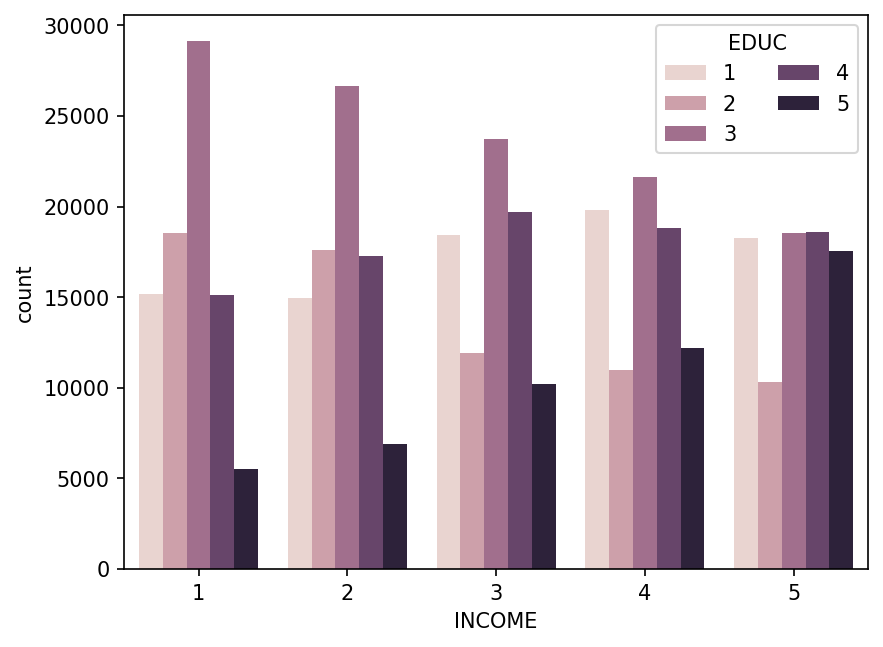
The income levels are ordinal (ranks) data, which is not numerical, and not normally distributed. Multiple groups are observed in both example, i.e., age group (from low to large) and rural (from low education level to high education level), thus, ANOVA’s alternatives could be used.
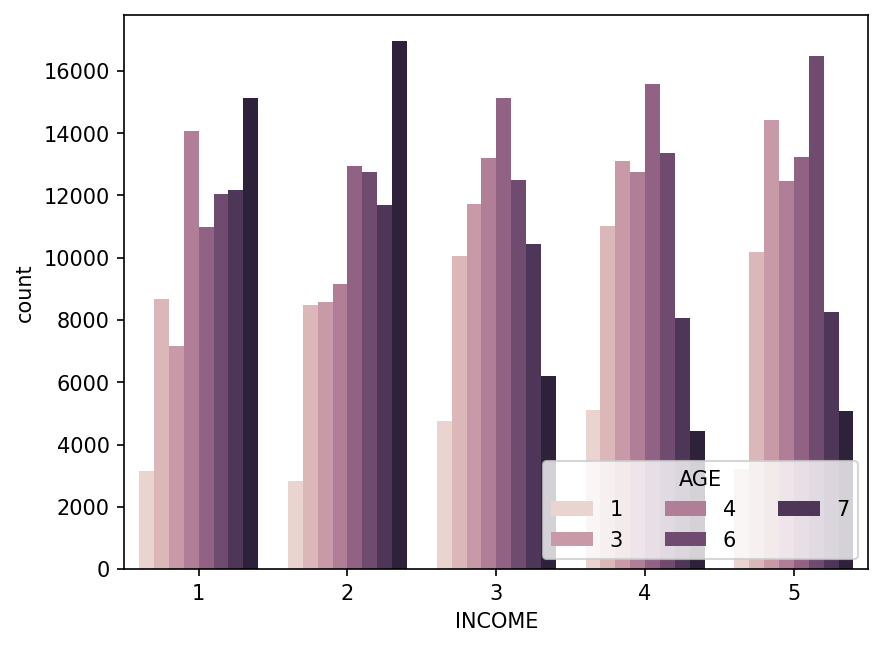
(a)by age
(b)by Education
Figure 3:Comparing the income level vs. age groups (a) and education levels (b). Data source: A global dataset of 7 billion individuals with socio-economic characteristics
- Ton, M. J., Ingels, M. W., de Bruijn, J. A., de Moel, H., Reimann, L., Botzen, W. J. W., & Aerts, J. C. J. H. (2024). A global dataset of 7 billion individuals with socio-economic characteristics. Scientific Data, 11(1). 10.1038/s41597-024-03864-2