Hypothesis testing is a key to quantify the differences in data.
Null hypothesis are usually ‘no effects’ or ‘no differences’.
T-test, ANOVA, and non-parametric tests could be used in various conditions.
T-test and ANOVA were designed with some assumptions and base distribution (t-distribution and F-distribution), which are prefered if the assumptions are met.
If the assumptions are violated, the statistical estimation is compromised and the accuracy is unknown.
Non-parametric tests can be used in that situation.
How to think statistically?
Some key points:
How to measure data quantitatively (or qualitatively)
nominal, ordinal, interval, ratio
binary, numerical, categorical
Are them different? Are them same?
designing the hypothesis
how to formulate a question
Are them related?
correlation, regression (not covered)
How to test/assess the hypothesis?
parametric, non-parametric
the assumptions behind each method
How to read the results (interpretation)?
significant at what level?
effect size?
how confidence are we?
Relating to the big picture
what this means in your big-aim / Reseearch Questions (RQ)
how visualisation can help linking back to your study
How to use these techniques and thinking in spatial data?
Table 1:A slice of HDB data table.
| Street | Flat Type | Floor Area (sqm) | Resale Age | Resale Price |
|---|---|---|---|---|
| ANG MO KIO AVE 10 | 2 ROOM | 44 | 44 | 267000 |
| ANG MO KIO AVE 3 | 2 ROOM | 49 | 46 | 300000 |
| ANG MO KIO AVE 3 | 2 ROOM | 44 | 45 | 280000 |
| ANG MO KIO AVE 3 | 2 ROOM | 44 | 45 | 282000 |
| ANG MO KIO AVE 4 | 2 ROOM | 45 | 37 | 289800 |
| ... | ... | ... | ... | ... |
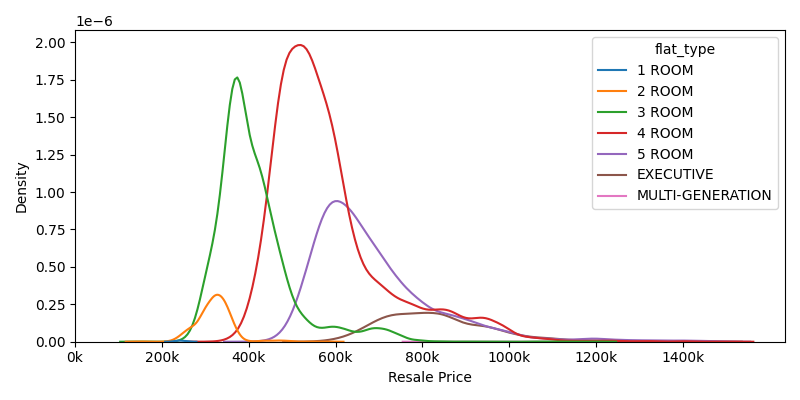
The differences between flat type?
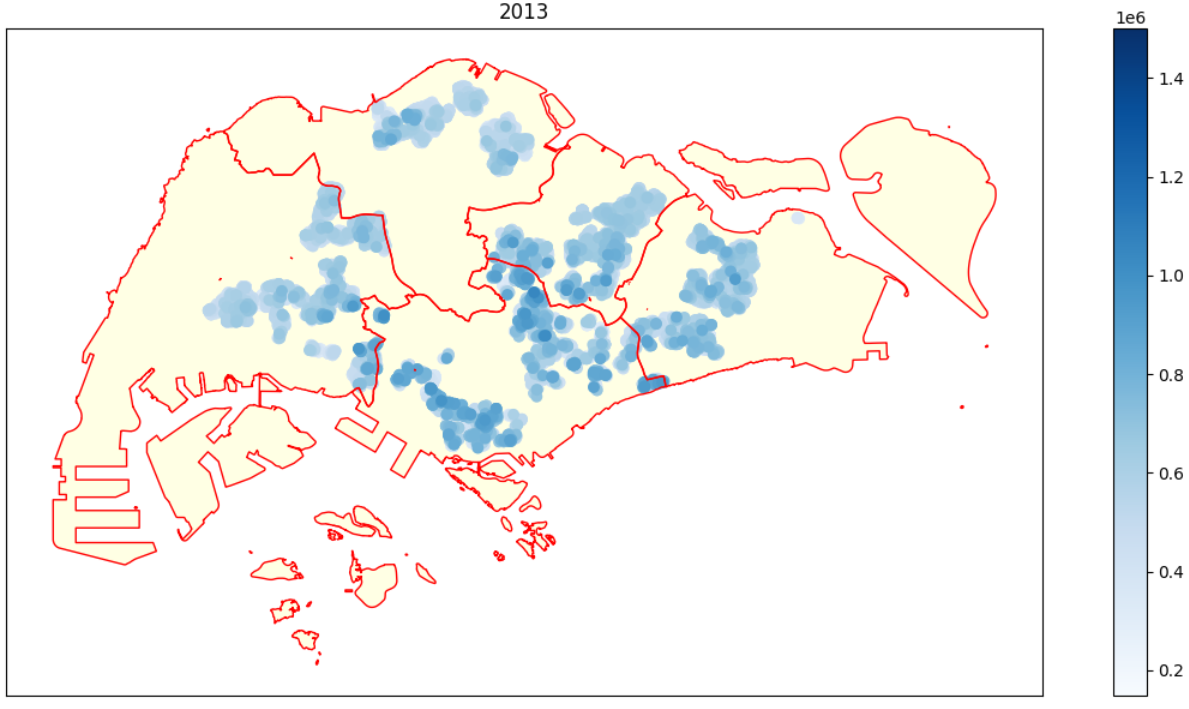
The differences between regions?
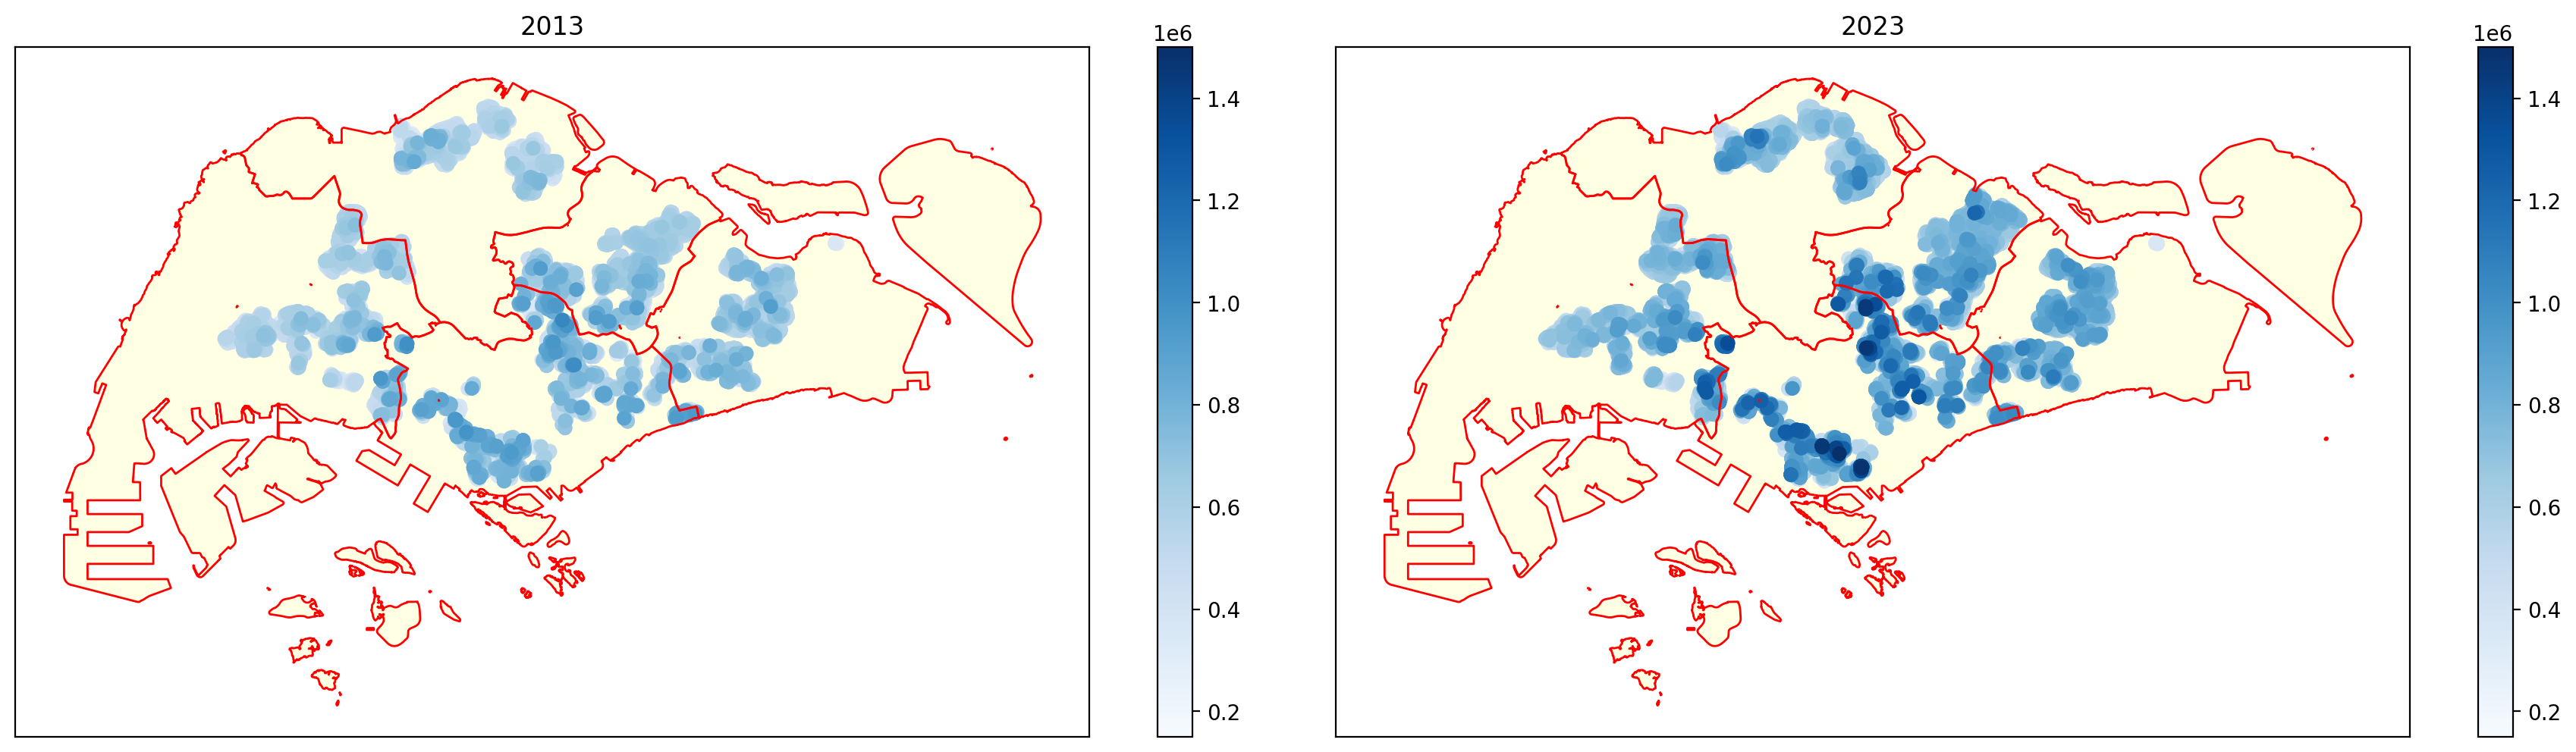
The differences between the two years?
Strategies to investigate spatial data differences
individual level comparison
directly analyzing the data table
transactions between flat types, between regions, between time, ...
each data point is considered independent from other data point
use statistical methods
spatially aggregated comparison
aggregate the data by spatial units (subzone, planning area)
the average price for 4 rooms for every subzone, ...
each spatial unit is considered independent from other spatial unit
use statistical methods
consider spatial relationship (nearby) effects
spatial relationship between data points or spatial units
the prices of the same type of house unit within the neighborhood (a search distance)...
data points or spatial units are consider spatially dependent
use spatial statistic methods